[https://doi.org/10.1051/0004-6361/202039640]
[https://doi.org/10.1051/0004-6361/202141096]
| Issue |
A&A
Volume 659, March 2022
|
|
|---|---|---|
| Article Number | C3 | |
| Number of page(s) | 3 | |
| Section | Planets and planetary systems | |
| DOI | https://doi.org/10.1051/0004-6361/202141096e | |
| Published online | 11 March 2022 | |
How drifting and evaporating pebbles shape giant planets (Corrigendum)
1
Max-Planck-Institut für Astronomie,
Königstuhl 17,
69117
Heidelberg,
Germany
2
Centre for ExoLife Sciences, Niels Bohr Institute,
Øster Voldgade 5,
1350
Copenhagen,
Denmark
e-mail: This email address is being protected from spambots. You need JavaScript enabled to view it.
3
Instituut voor Sterrenkunde,
KU Leuven, Celestijnenlaan 200D,
3001
Leuven,
Belgium
Key words: accretion, accretion disks / planets and satellites: formation / protoplanetary disks / planet-disk interactions / errata, addenda
The published Papers I and II made use of a chemical partitioning model that did not conserve the nitrogen abundance. The correct N2 abundance should have been 0.45 × N/H instead of 0.9 × N/H (see Table 1). This change in the N2 abundance results in a wrong ratio of nitrogen-bearing species to other molecular species, even though the total heavy element content was still conserved. Rerunning all simulations, we find that the general outcome of our simulations remains unchanged, except for the nitrogen content shown in Paper II. We have therefore updated Figs. 2, 3, and 5 from Paper II to include the updated chemical model with the correct partitioning of nitrogen. Correcting the fraction of N2 by decreasing N2 slightly increases the amount of other heavy molecular species, as can be seen in Figs. 1 and 2. The resulting volatile-to-refractory ratio is therefore subsequently slightly smaller, since N2 is volatile.
The model of Jupiter and Saturn with additional solid enrichment has been updated to include less solids (see Table 2) to still match the sulfur abundance of Jupiter and Saturn. The updated Fig. 3 still demonstrates that Jupiter’s nitrogen abundance could have been influenced by the drift and evaporation of N2-bearing pebbles. While there is a slight difference in the nitrogen abundance in the planetary atmospheres from the updated model, the general conclusions of our simulations in Papers I and II remain untouched.
Condensation temperature and volume mixing ratio of N2.
Additional solid enrichment.
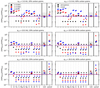 |
Fig. 1 Final atmospheric compositions of the planets shown in Fig. 1 of Paper II normalized to the solar composition. We also show the C/O ratio normalized to the solar value on the right of each panel, with Jupiter’s C/O ratio marked in gray (Atreya et al. 2016; Li et al. 2020), as well as the volatile-to-refractory ratio, which we calculate as the ratio of volatile to refractory molecules in the atmosphere. Left panels: models with 20% of the carbon abundance locked in refractory carbon grains, whereas right panels: models with 60% locked in carbon grains. The circles mark the composition of the pure atmosphere, while the triangles mark the composition if the core were completely mixed into the atmosphere. |
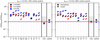 |
Fig. 2 As Fig. 1, but with the addition of 30 Earth masses of solids into the atmosphere. We only show the results of the planets starting at 3.0 AU because the addition of extra solids into the atmospheres results in the same trends for planets starting farther away from the star. |
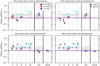 |
Fig. 3 Atmospheric compositions of Jupiter and Saturn from our model and the corresponding observations (Atreya et al. 2016; Li et al. 2020). Left panels: models with 20% of the carbon abundance locked in refractory carbon grains, whereas right panels: models with 60% locked in carbon grains. Bottom panels: effect of additional solids added to the atmosphere (see Table 2). The gray bands correspond to measurements in Jupiter’s atmosphere, while the horizontal light blue line marks the measurements for Saturn. We show here only the atmospheric abundances without mixing of the planetary core into the atmosphere because Jupiter has a core (Wahl et al. 2017). The refractory content is zero if we do not add any additional solids because our model does not allow the accretion of solids during the gas accretion phase. |
References
- Atreya, S. K., Crida, A., Guillot, T., et al. 2016, ArXiv e-prints [arXiv:1606.04510] [Google Scholar]
- Li, C., Ingersoll, A., Bolton, S., et al. 2020, Nat. Astron., 4, 609 [Google Scholar]
- Lodders, K. 2003, ApJ, 591, 1220 [Google Scholar]
- Madhusudhan, N., Crouzet, N., McCullough, P. R., Deming, D., & Hedges, C. 2014, ApJ, 791, L9 [Google Scholar]
- Wahl, S. M., Hubbard, W. B., Militzer, B., et al. 2017, Geophys. Res. Lett., 44, 4649 [CrossRef] [Google Scholar]
© A. D. Schneider and B. Bitsch 2022
 Open Access article, published by EDP Sciences, under the terms of the Creative Commons Attribution License (https://creativecommons.org/licenses/by/4.0), which permits unrestricted use, distribution, and reproduction in any medium, provided the original work is properly cited.
Open Access funding provided by Max Planck Society.
All Tables
All Figures
|
Fig. 1 Final atmospheric compositions of the planets shown in Fig. 1 of Paper II normalized to the solar composition. We also show the C/O ratio normalized to the solar value on the right of each panel, with Jupiter’s C/O ratio marked in gray (Atreya et al. 2016; Li et al. 2020), as well as the volatile-to-refractory ratio, which we calculate as the ratio of volatile to refractory molecules in the atmosphere. Left panels: models with 20% of the carbon abundance locked in refractory carbon grains, whereas right panels: models with 60% locked in carbon grains. The circles mark the composition of the pure atmosphere, while the triangles mark the composition if the core were completely mixed into the atmosphere. |
| In the text | |
|
Fig. 2 As Fig. 1, but with the addition of 30 Earth masses of solids into the atmosphere. We only show the results of the planets starting at 3.0 AU because the addition of extra solids into the atmospheres results in the same trends for planets starting farther away from the star. |
| In the text | |
|
Fig. 3 Atmospheric compositions of Jupiter and Saturn from our model and the corresponding observations (Atreya et al. 2016; Li et al. 2020). Left panels: models with 20% of the carbon abundance locked in refractory carbon grains, whereas right panels: models with 60% locked in carbon grains. Bottom panels: effect of additional solids added to the atmosphere (see Table 2). The gray bands correspond to measurements in Jupiter’s atmosphere, while the horizontal light blue line marks the measurements for Saturn. We show here only the atmospheric abundances without mixing of the planetary core into the atmosphere because Jupiter has a core (Wahl et al. 2017). The refractory content is zero if we do not add any additional solids because our model does not allow the accretion of solids during the gas accretion phase. |
| In the text | |
Current usage metrics show cumulative count of Article Views (full-text article views including HTML views, PDF and ePub downloads, according to the available data) and Abstracts Views on Vision4Press platform.
Data correspond to usage on the plateform after 2015. The current usage metrics is available 48-96 hours after online publication and is updated daily on week days.
Initial download of the metrics may take a while.