[https://doi.org/10.1051/0004-6361/202039640]
[https://doi.org/10.1051/0004-6361/202141096]
Fig. 1
Download original image
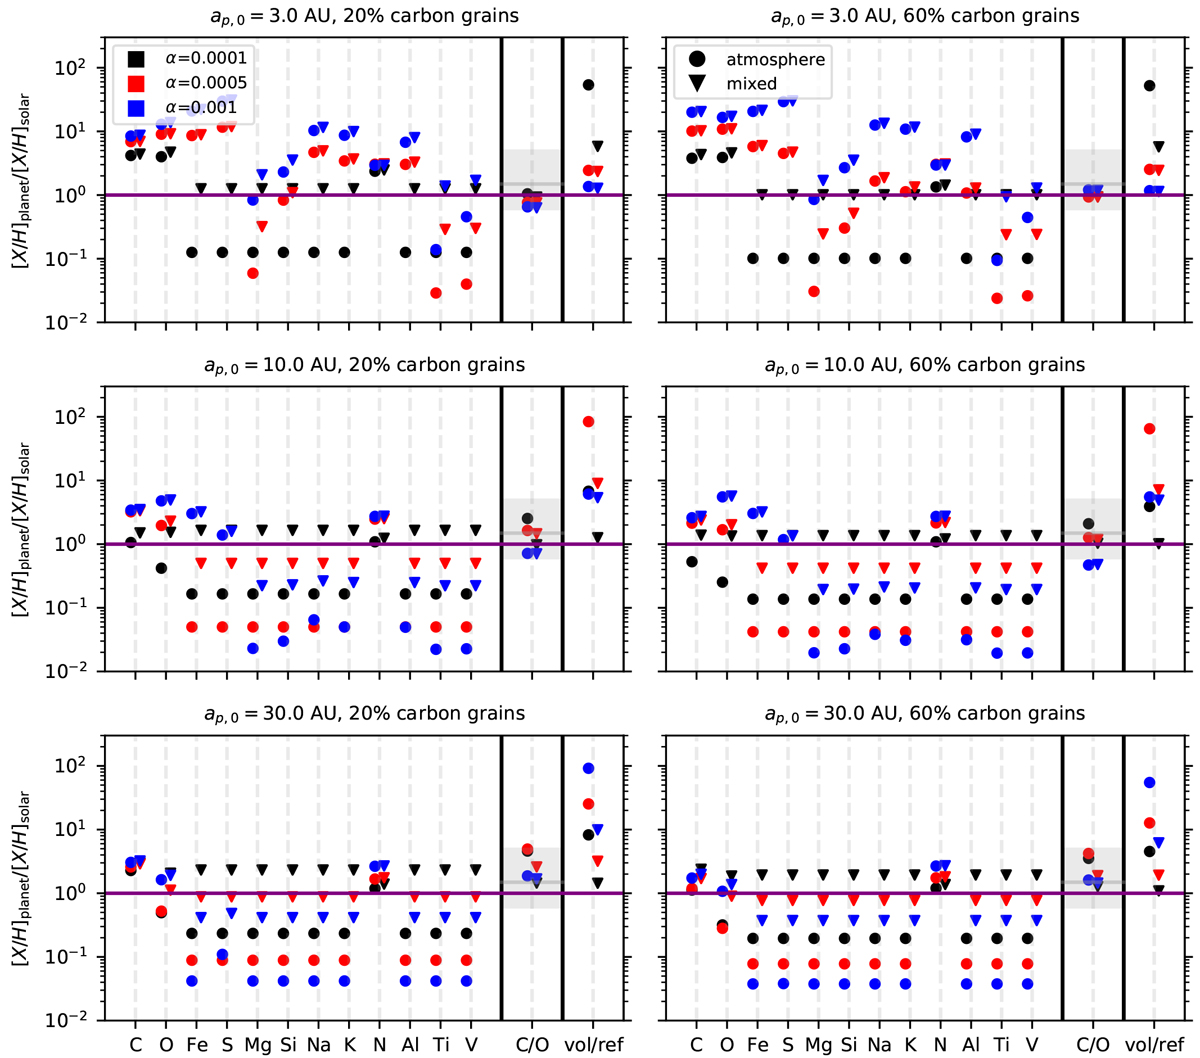
Final atmospheric compositions of the planets shown in Fig. 1 of Paper II normalized to the solar composition. We also show the C/O ratio normalized to the solar value on the right of each panel, with Jupiter’s C/O ratio marked in gray (Atreya et al. 2016; Li et al. 2020), as well as the volatile-to-refractory ratio, which we calculate as the ratio of volatile to refractory molecules in the atmosphere. Left panels: models with 20% of the carbon abundance locked in refractory carbon grains, whereas right panels: models with 60% locked in carbon grains. The circles mark the composition of the pure atmosphere, while the triangles mark the composition if the core were completely mixed into the atmosphere.
Current usage metrics show cumulative count of Article Views (full-text article views including HTML views, PDF and ePub downloads, according to the available data) and Abstracts Views on Vision4Press platform.
Data correspond to usage on the plateform after 2015. The current usage metrics is available 48-96 hours after online publication and is updated daily on week days.
Initial download of the metrics may take a while.