Fig. 1.
Download original image
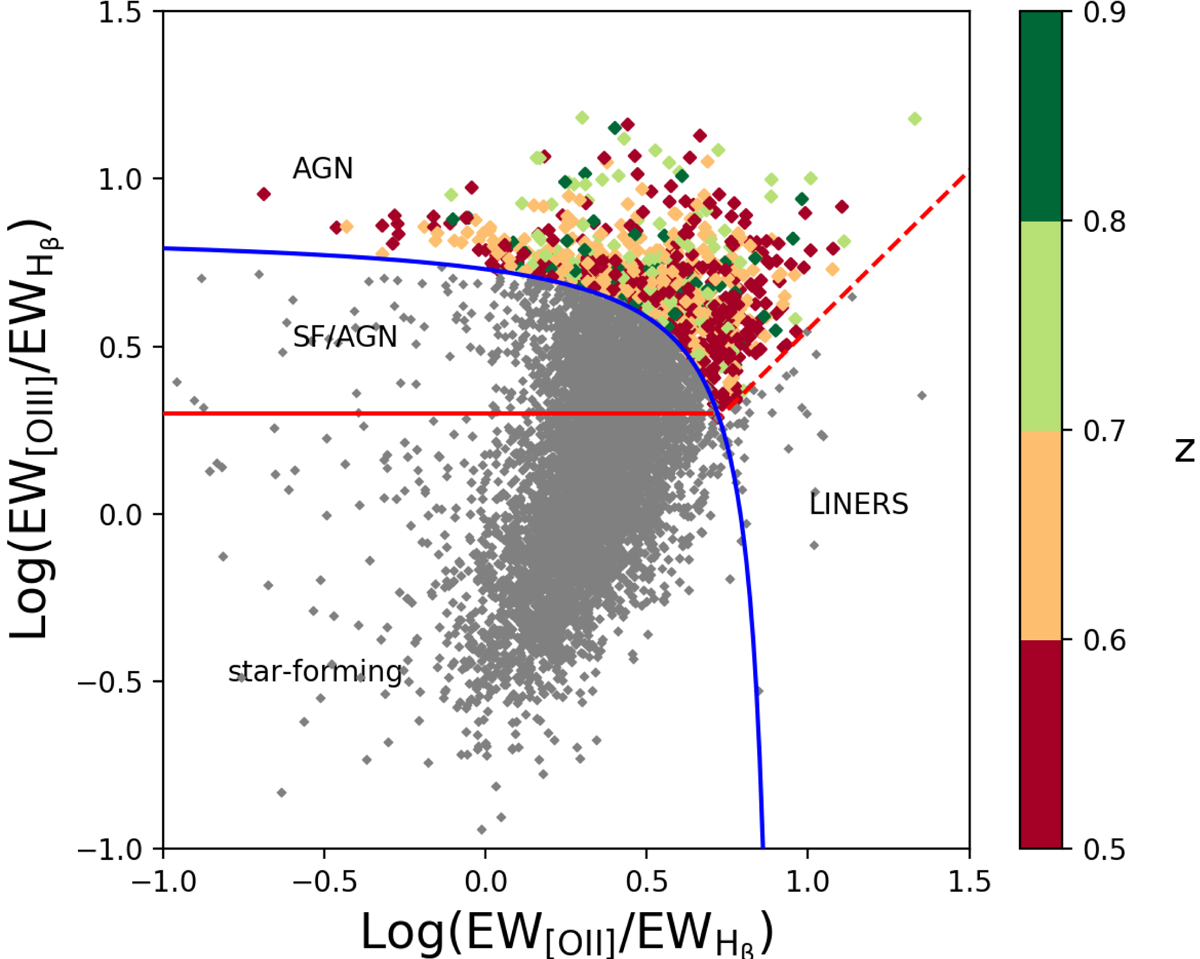
Blue diagram (Lamareille 2010) for the VIMOS sample. Diamonds represent Type II AGN; they are colour-coded according to their redshift. VIMOS galaxies with reliable emission line measurements are shown as grey dots. The blue curve shows the separations between star-forming galaxies and AGN (Eq. (1)), the red dashed line between AGN and LINERs (Eq. (2)), the red solid line between star-forming galaxies and SF/AGN (Eq. (3)).
Current usage metrics show cumulative count of Article Views (full-text article views including HTML views, PDF and ePub downloads, according to the available data) and Abstracts Views on Vision4Press platform.
Data correspond to usage on the plateform after 2015. The current usage metrics is available 48-96 hours after online publication and is updated daily on week days.
Initial download of the metrics may take a while.