Fig. 8.
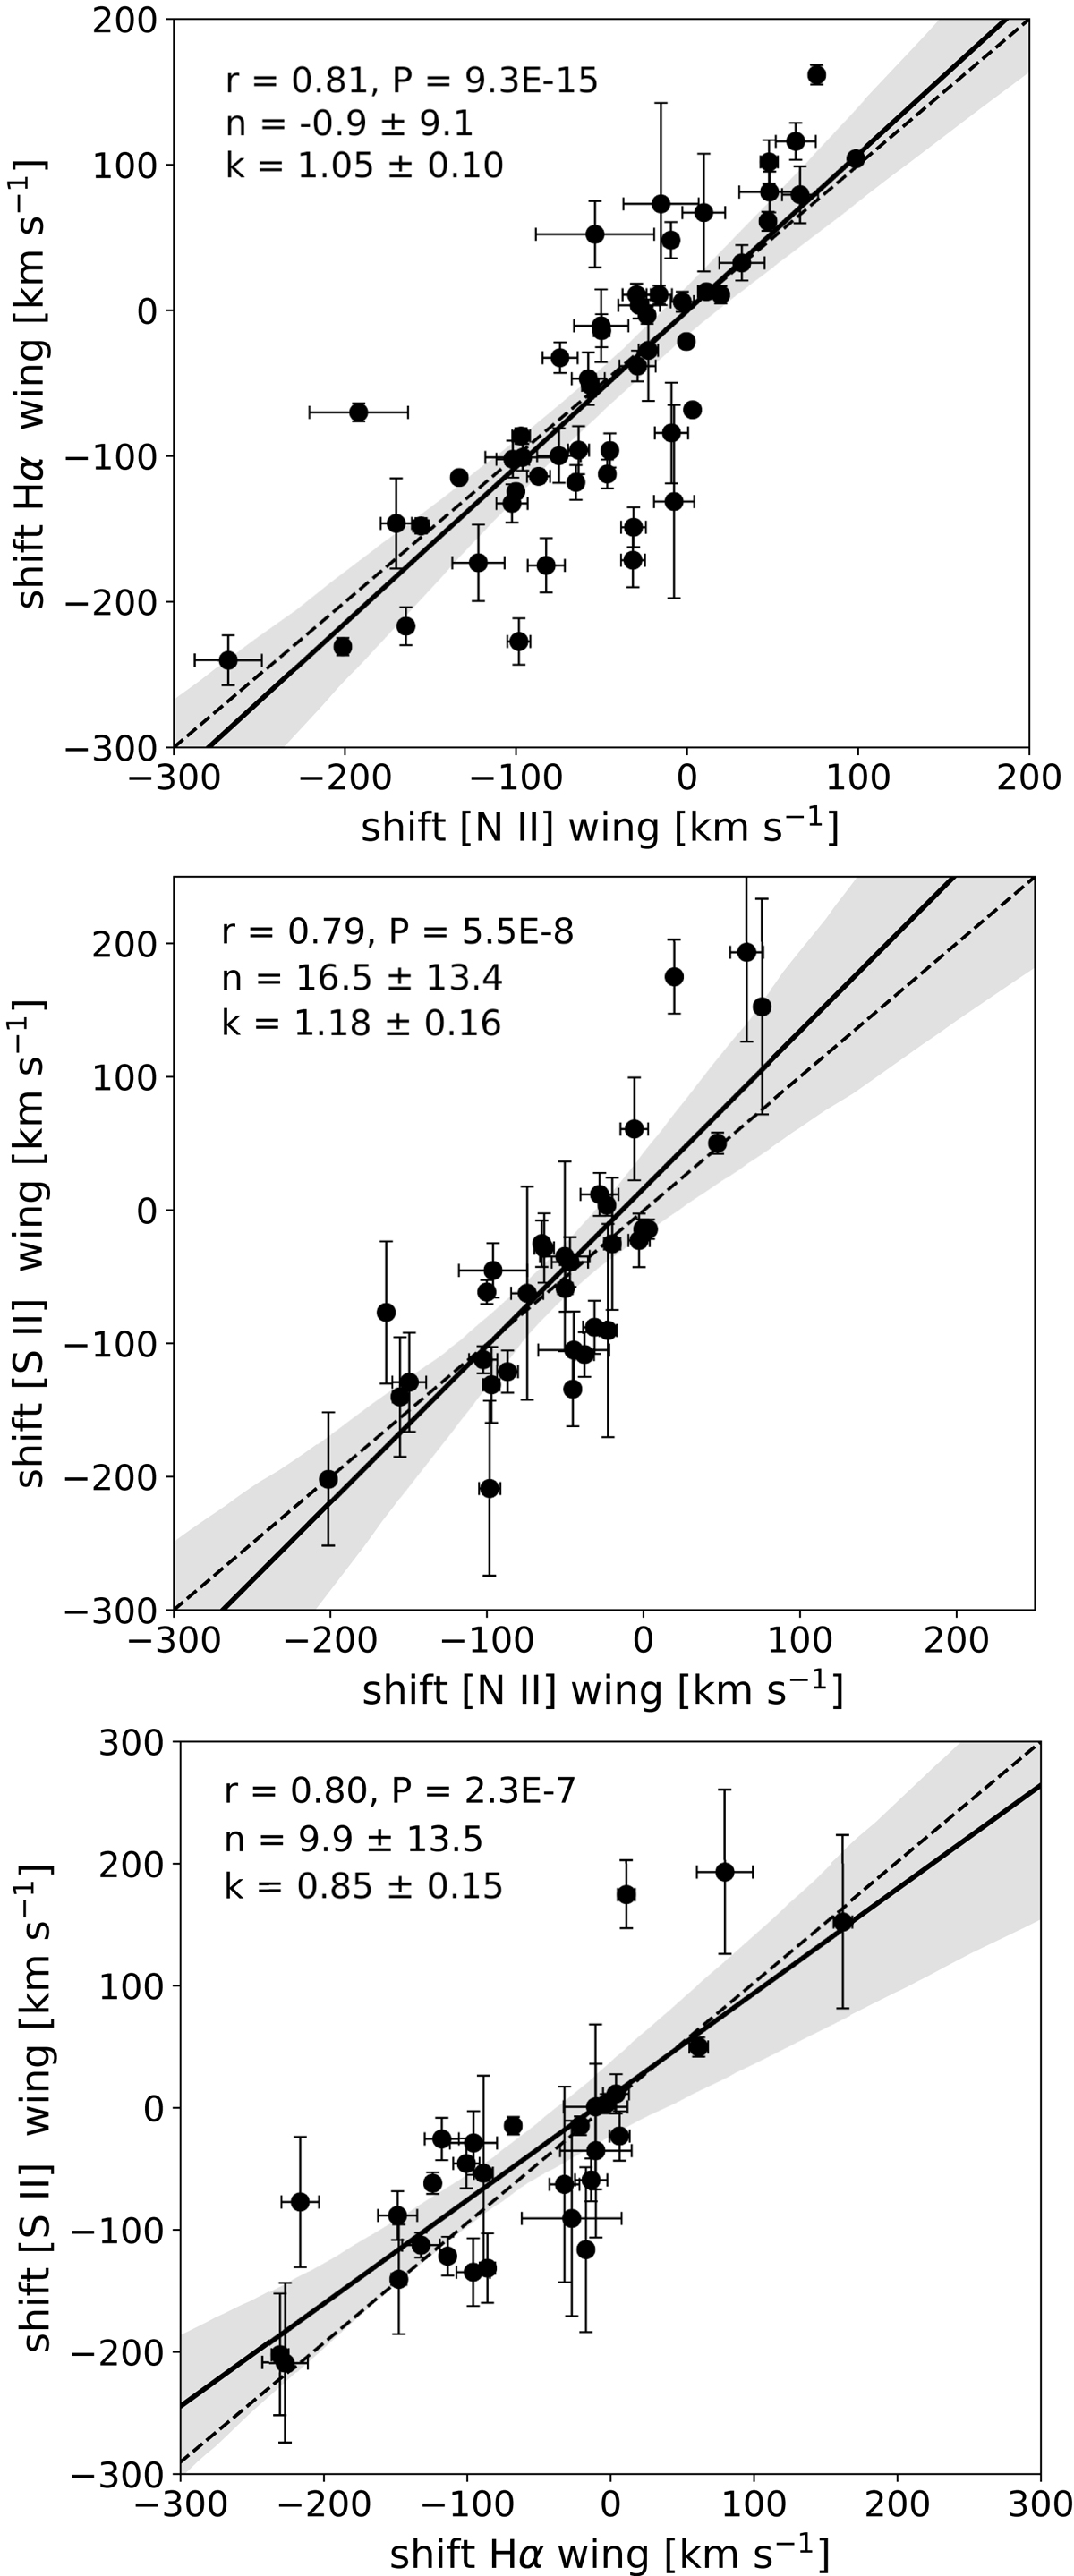
Download original image
Correlations between the shifts of the [N II], [S II], and Hα wing components in the unblended subsample (r – coefficient of correlation, and appropriate P-value are given). The data are fitted with a linear function Y = k ⋅ X + n (solid line), where k is the slope and n the intercept of the best linear fit. The one-to-one relation is denoted with a dashed line. The shaded region corresponds to the 95% confidence interval.
Current usage metrics show cumulative count of Article Views (full-text article views including HTML views, PDF and ePub downloads, according to the available data) and Abstracts Views on Vision4Press platform.
Data correspond to usage on the plateform after 2015. The current usage metrics is available 48-96 hours after online publication and is updated daily on week days.
Initial download of the metrics may take a while.