Free Access
Fig. 5.
Download original image
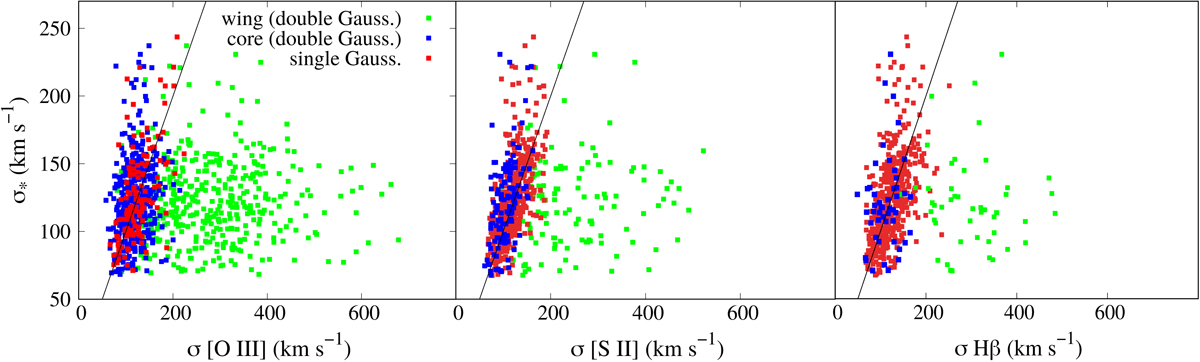
Correlations between σ* and the widths of single-Gaussian lines (red dots), and the wing and core components of the double-Gaussian lines (green and blue dots) for [O III], [S II], and Hβ lines (total sample). The one-to-one relation is denoted with the solid line.
Current usage metrics show cumulative count of Article Views (full-text article views including HTML views, PDF and ePub downloads, according to the available data) and Abstracts Views on Vision4Press platform.
Data correspond to usage on the plateform after 2015. The current usage metrics is available 48-96 hours after online publication and is updated daily on week days.
Initial download of the metrics may take a while.