Fig. 2.
Download original image
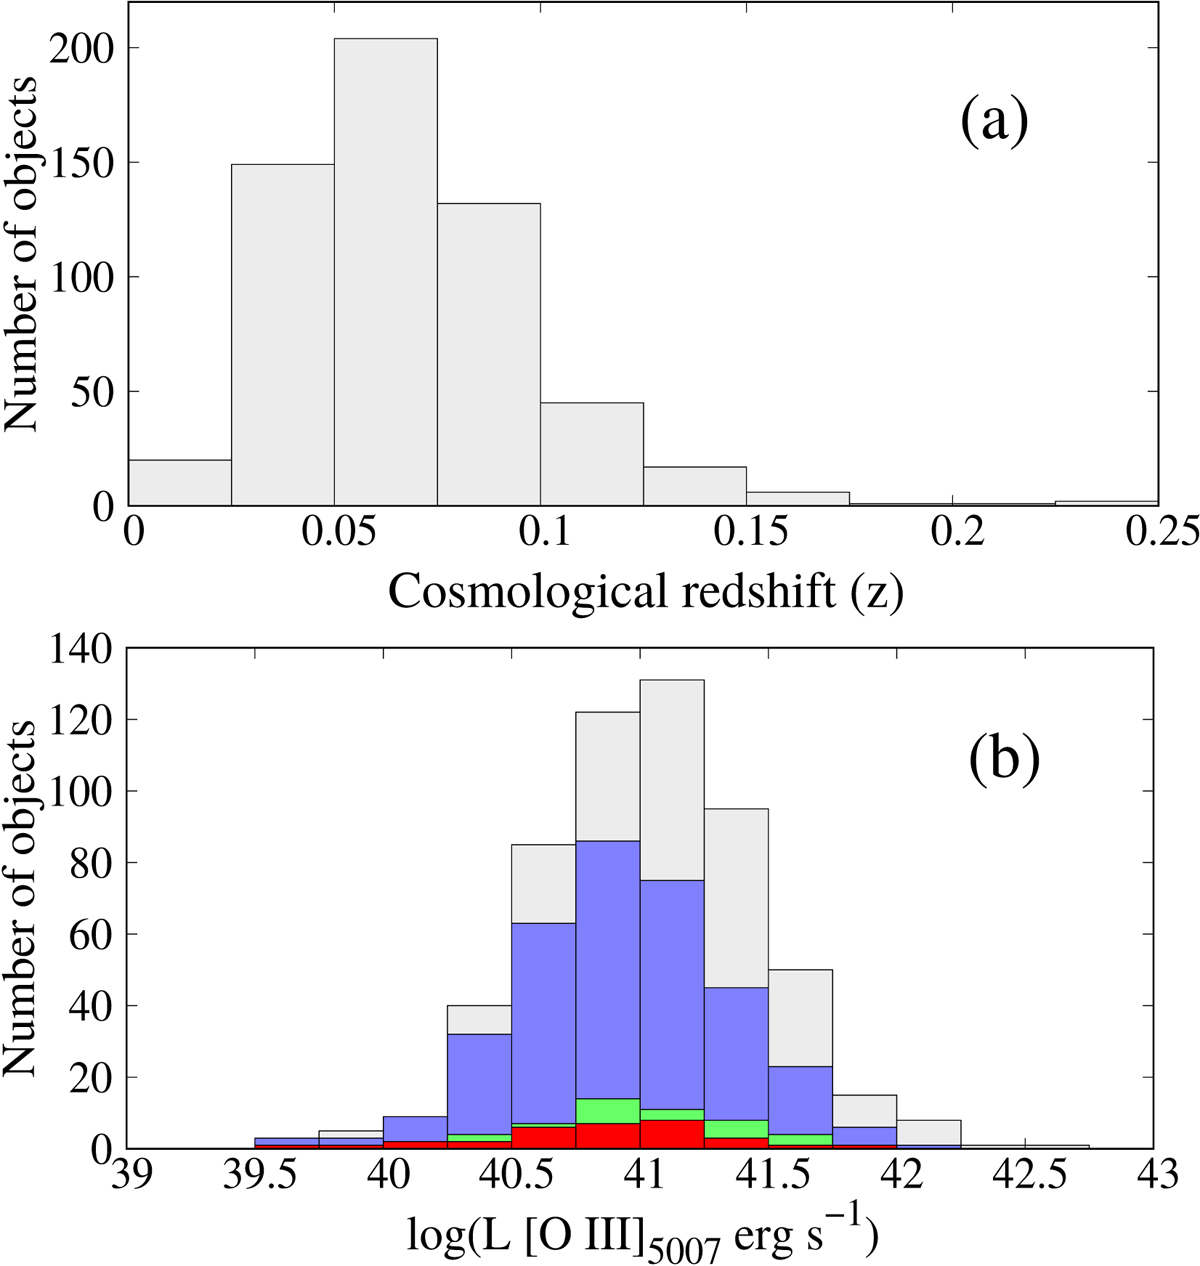
(a) Histogram of the distribution of cosmological redshift for the total sample. (b) Histogram of the distribution of [O III]λ 5007 Å luminosity for the total sample (grey bars) and for different subsets (unblended subsample – blue bars, objects from unblended subsample with detected wing components in both Hα and [N II] lines – green bars, and the same but for [N II] and [S II] lines – red bars.
Current usage metrics show cumulative count of Article Views (full-text article views including HTML views, PDF and ePub downloads, according to the available data) and Abstracts Views on Vision4Press platform.
Data correspond to usage on the plateform after 2015. The current usage metrics is available 48-96 hours after online publication and is updated daily on week days.
Initial download of the metrics may take a while.