Free Access
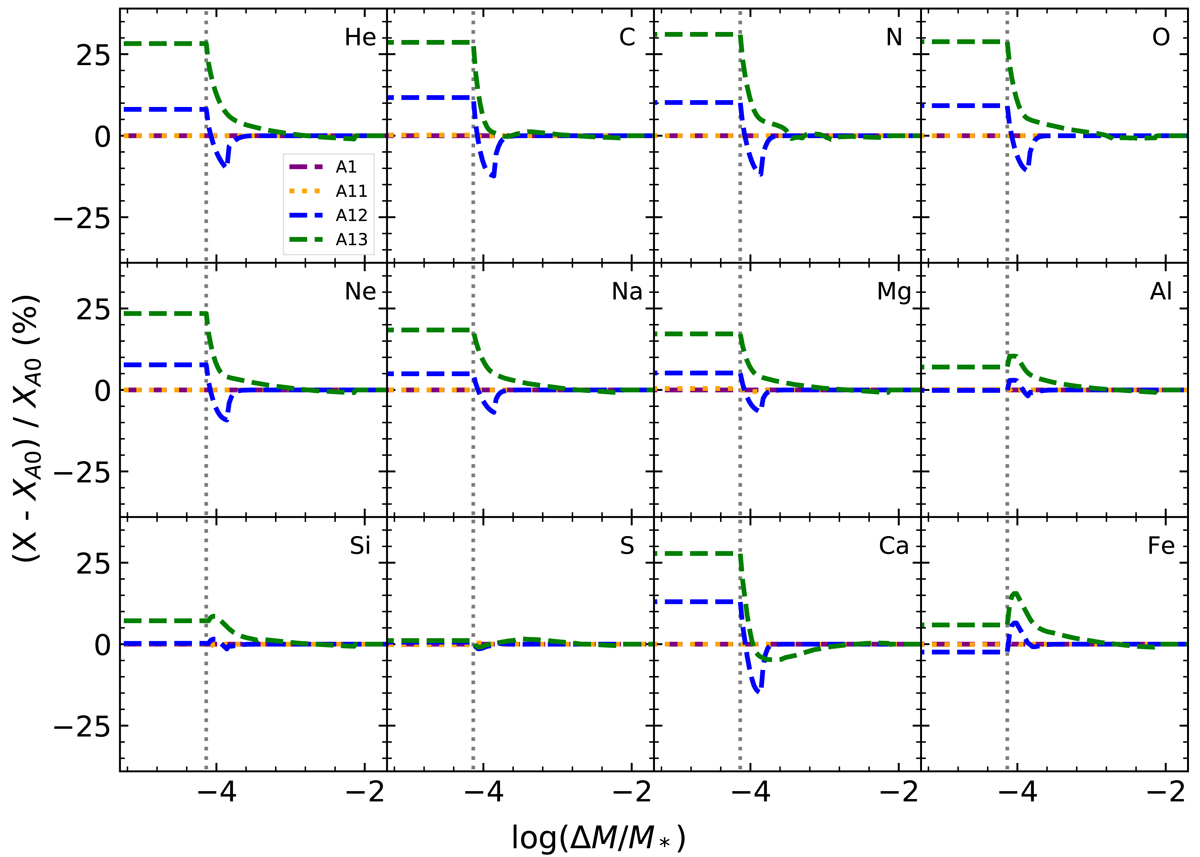
Fig. A.1.
Download original image
Relative difference between the abundance profiles resulting from option 1 (diffusion_min_dq_at_surface) tests at 420 Myr for 1.4M⊙ models and the A0 model. The option 1 values for each model are given in Table A.2. The vertical dotted line represents the bottom of the surface convection zone of the A0 model.
Current usage metrics show cumulative count of Article Views (full-text article views including HTML views, PDF and ePub downloads, according to the available data) and Abstracts Views on Vision4Press platform.
Data correspond to usage on the plateform after 2015. The current usage metrics is available 48-96 hours after online publication and is updated daily on week days.
Initial download of the metrics may take a while.