Free Access
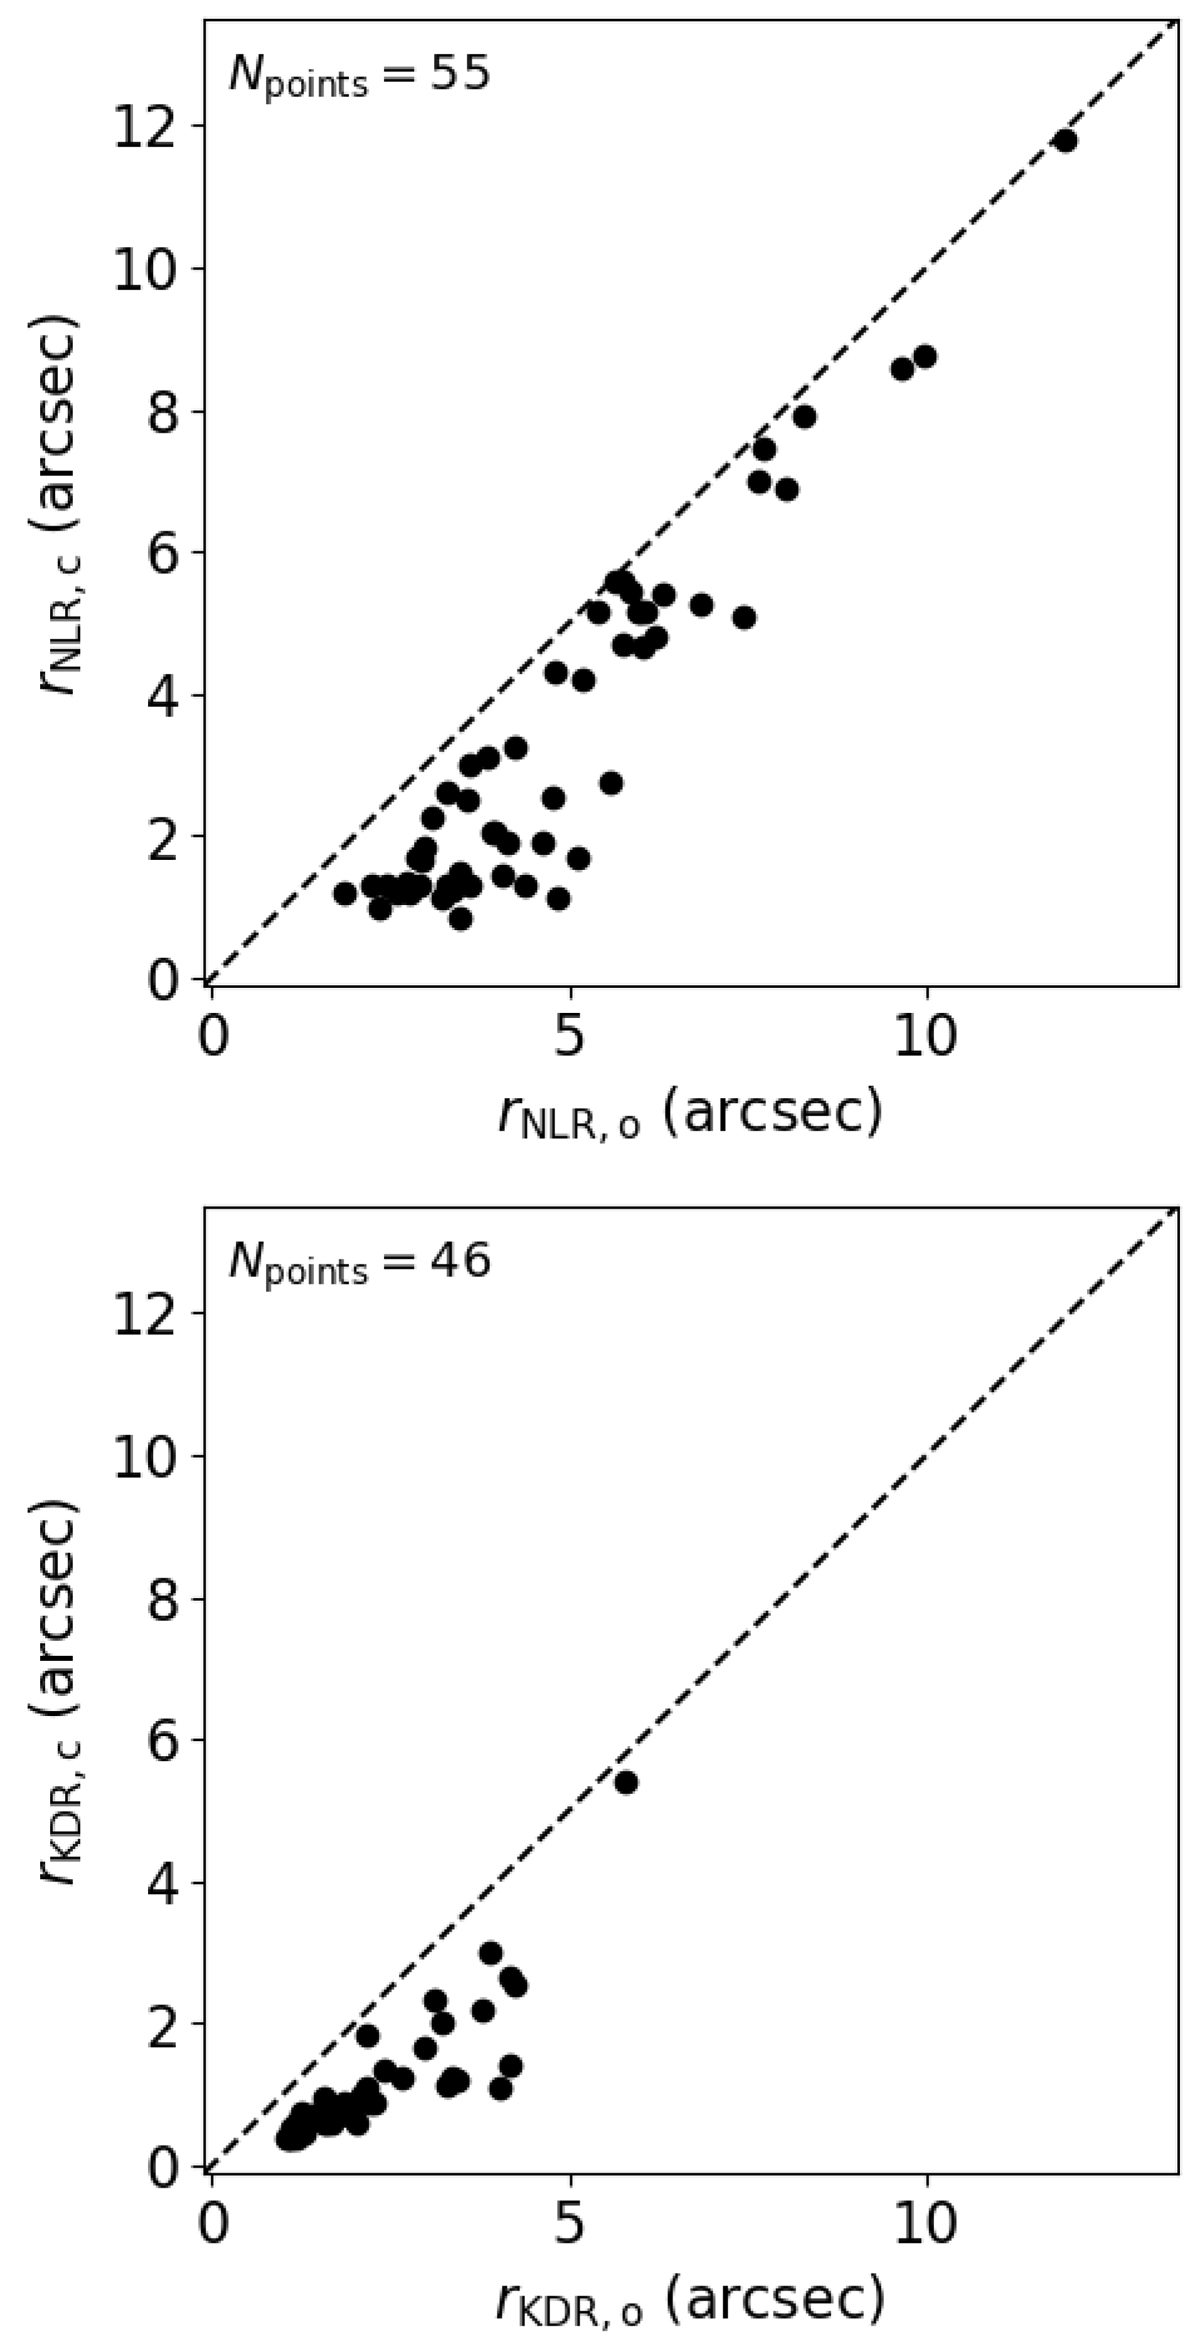
Fig. 9.
Download original image
Comparison of the raw estimates of the extents of the NLR (top) and KDR (bottom) with the corrected sizes obtained after deconvolving the [O III] brightness profiles (see text). The dashed lines indicate the locus of the 1:1 relation.
Current usage metrics show cumulative count of Article Views (full-text article views including HTML views, PDF and ePub downloads, according to the available data) and Abstracts Views on Vision4Press platform.
Data correspond to usage on the plateform after 2015. The current usage metrics is available 48-96 hours after online publication and is updated daily on week days.
Initial download of the metrics may take a while.