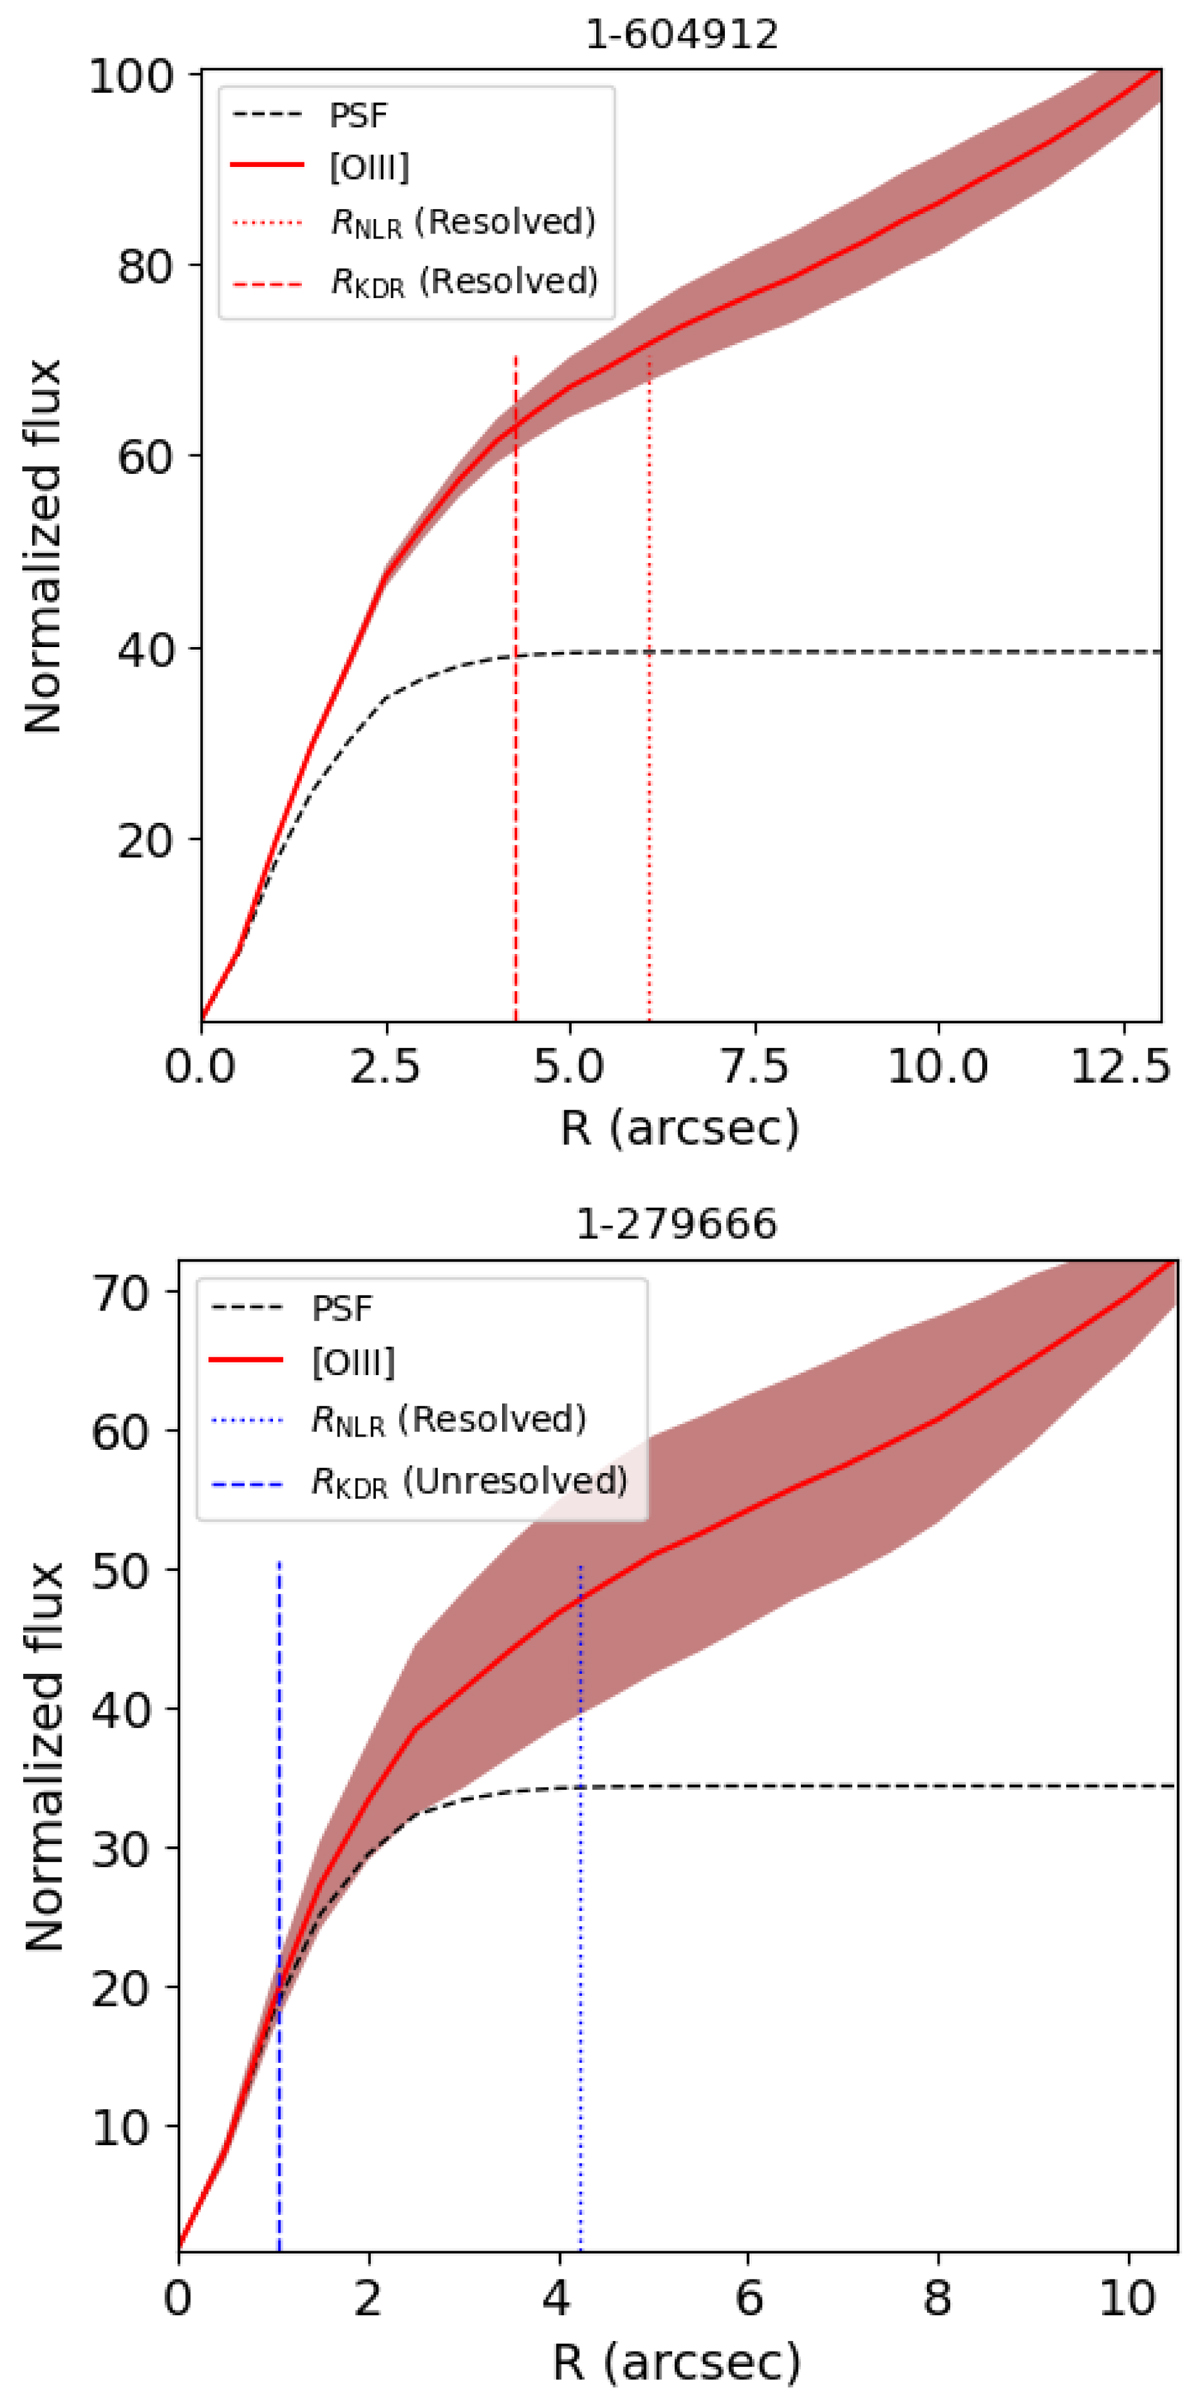
Fig. 8.
Download original image
Examples of curves of growth. The black dashed line corresponds to the PSF, and the red line shows the [O III]λ5007 flux and curve of growth. The shaded regions delineate the 1σ flux uncertainties. The vertical dotted and dashed lines show the observed radii of the NLR and KDR, respectively. The mangaid of the galaxies are identified in the title of each panel.
Current usage metrics show cumulative count of Article Views (full-text article views including HTML views, PDF and ePub downloads, according to the available data) and Abstracts Views on Vision4Press platform.
Data correspond to usage on the plateform after 2015. The current usage metrics is available 48-96 hours after online publication and is updated daily on week days.
Initial download of the metrics may take a while.