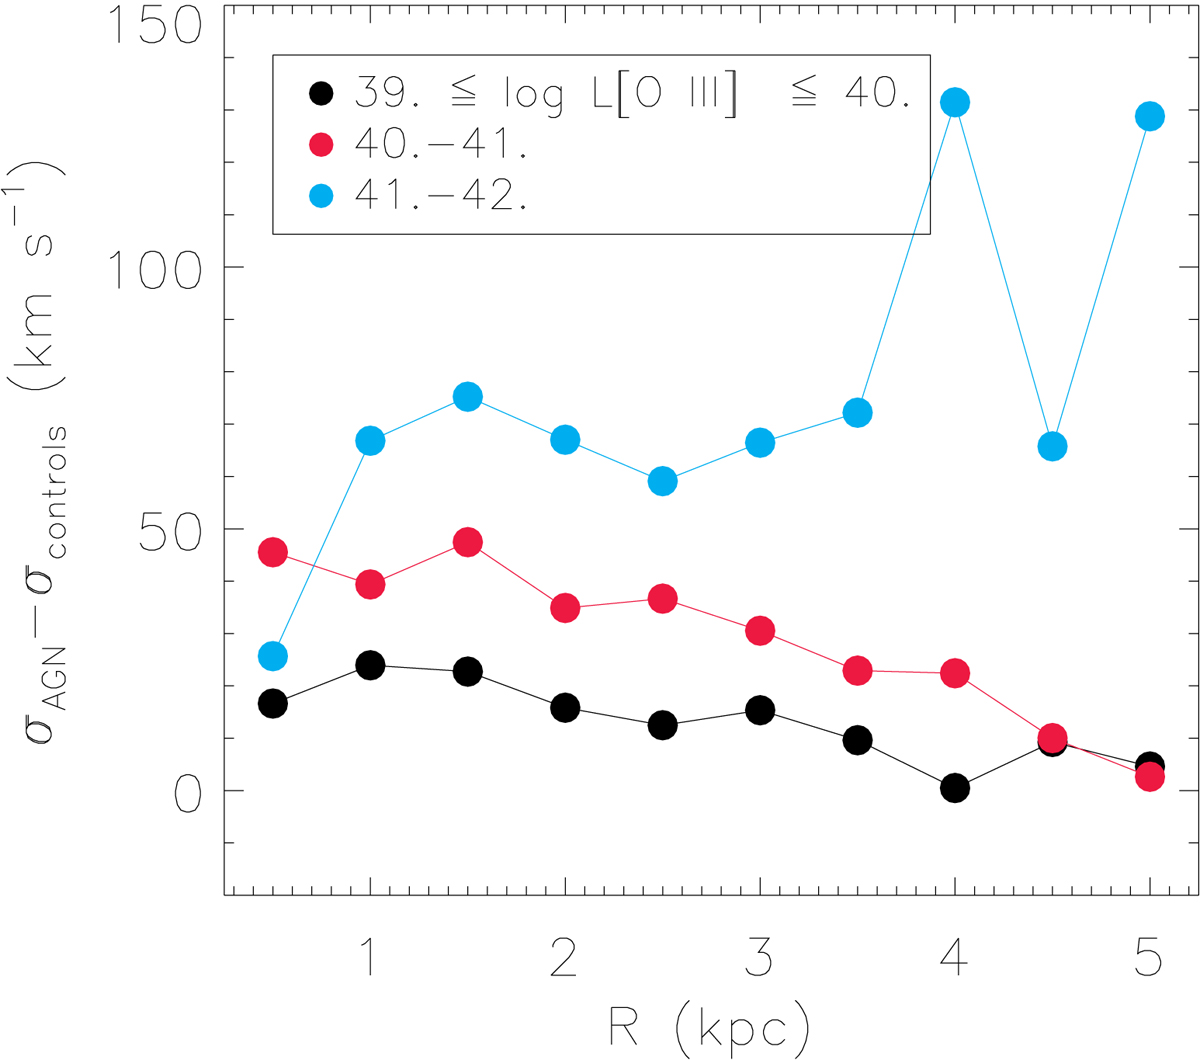
Fig. 7.
Download original image
Median radial profile of the σ difference between AGNs and controls. Each AGN was compared to its respective control galaxies. The coloured lines indicate different bins of [O III]λ5007 luminosity, on a logarithmic scale. Over all the analysed extension, the largest differences between an AGN and control velocity dispersions were observed for the most luminous AGN hosts.
Current usage metrics show cumulative count of Article Views (full-text article views including HTML views, PDF and ePub downloads, according to the available data) and Abstracts Views on Vision4Press platform.
Data correspond to usage on the plateform after 2015. The current usage metrics is available 48-96 hours after online publication and is updated daily on week days.
Initial download of the metrics may take a while.