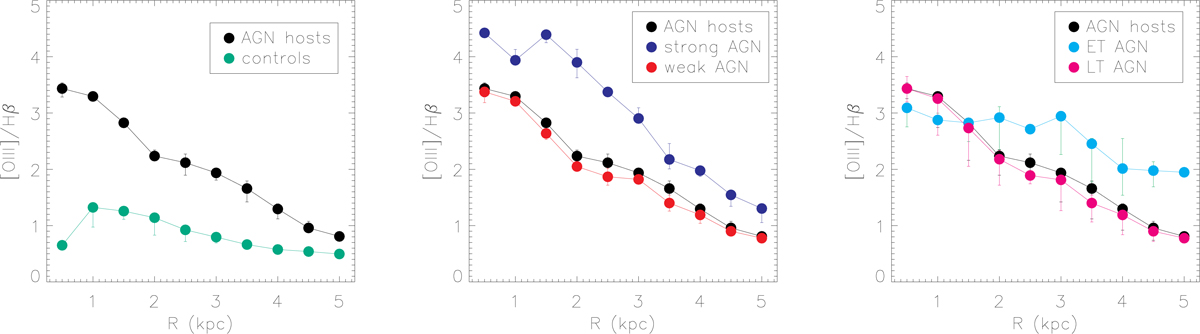
Fig. 5.
Download original image
Comparison of the [O III]λ5007/Hβ line ratio spatial profiles. Each point represents the azimuthal median value of the quantities in a bin of 0.5 kpc. The error bars present the standard deviation of the quantities, divided by the square root of the number of spaxels. Left panel: AGN hosts (black) and controls (green); central panel: strong (dark blue) and weak (red) AGNs; right panel: early-type (light blue) and late-type (pink) AGNs.
Current usage metrics show cumulative count of Article Views (full-text article views including HTML views, PDF and ePub downloads, according to the available data) and Abstracts Views on Vision4Press platform.
Data correspond to usage on the plateform after 2015. The current usage metrics is available 48-96 hours after online publication and is updated daily on week days.
Initial download of the metrics may take a while.