Fig. 4.
Download original image
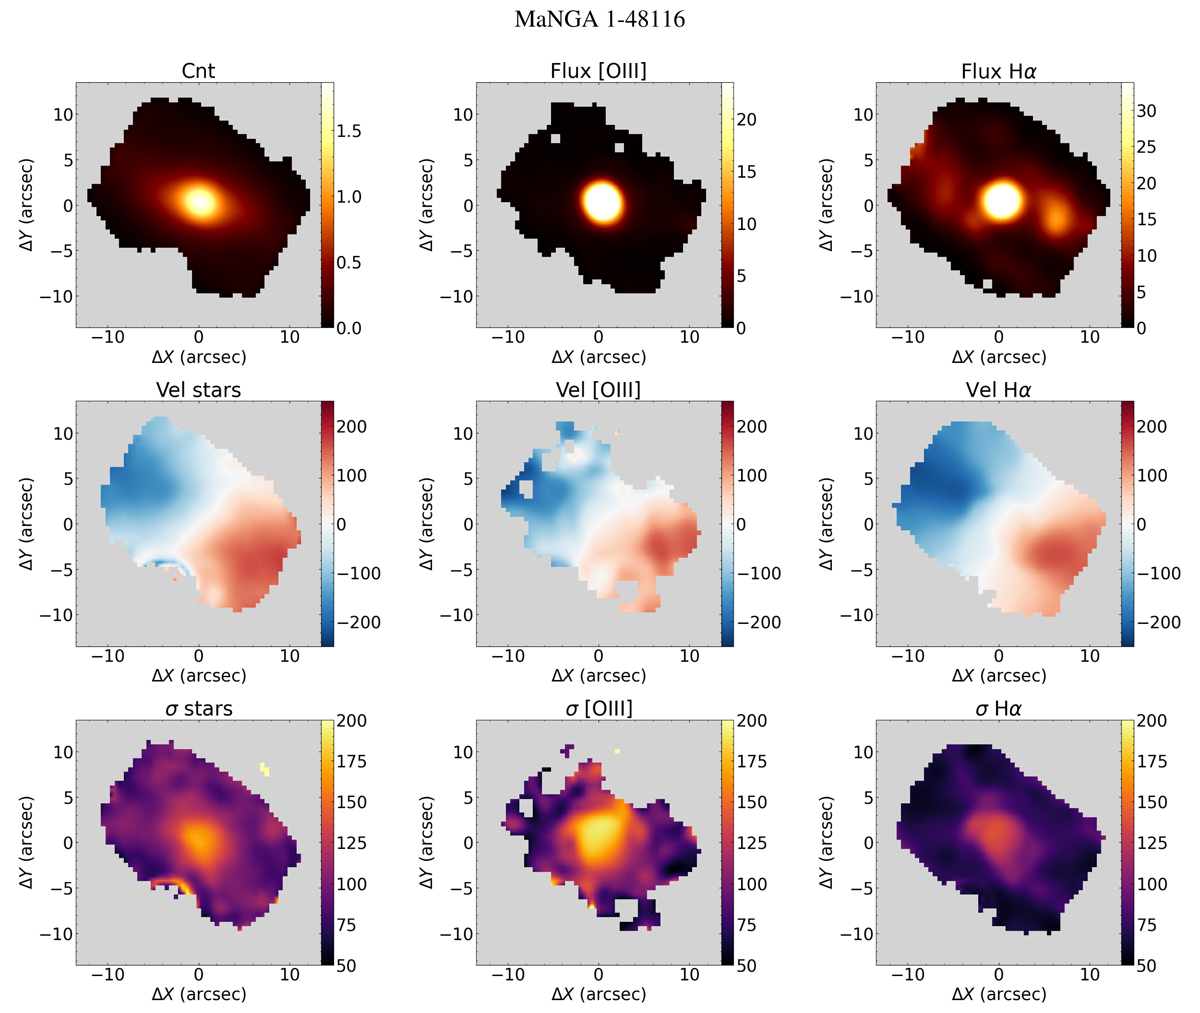
Example of maps we obtained from our measurements for the galaxy MaNGA 1-48116. First row: from left to right, a continuum map in units of 10−17 erg s−1 cm−2 Å−1 obtained by collapsing the whole spectral range, the [O III]5007 Å and Hα flux maps in units of 10−17 erg s−1 cm−2. Second row: from left to right, the stellar, [O III], and Hα velocity fields in km s−1, relatively to the systemic velocity of the galaxy. Bottom row: velocity dispersion maps for the stars, [O III], and Hα, from left to right. In all panels, the north points up and east to the left, and the ΔX and ΔY labels show the distance relative to the peak of the continuum emission.
Current usage metrics show cumulative count of Article Views (full-text article views including HTML views, PDF and ePub downloads, according to the available data) and Abstracts Views on Vision4Press platform.
Data correspond to usage on the plateform after 2015. The current usage metrics is available 48-96 hours after online publication and is updated daily on week days.
Initial download of the metrics may take a while.