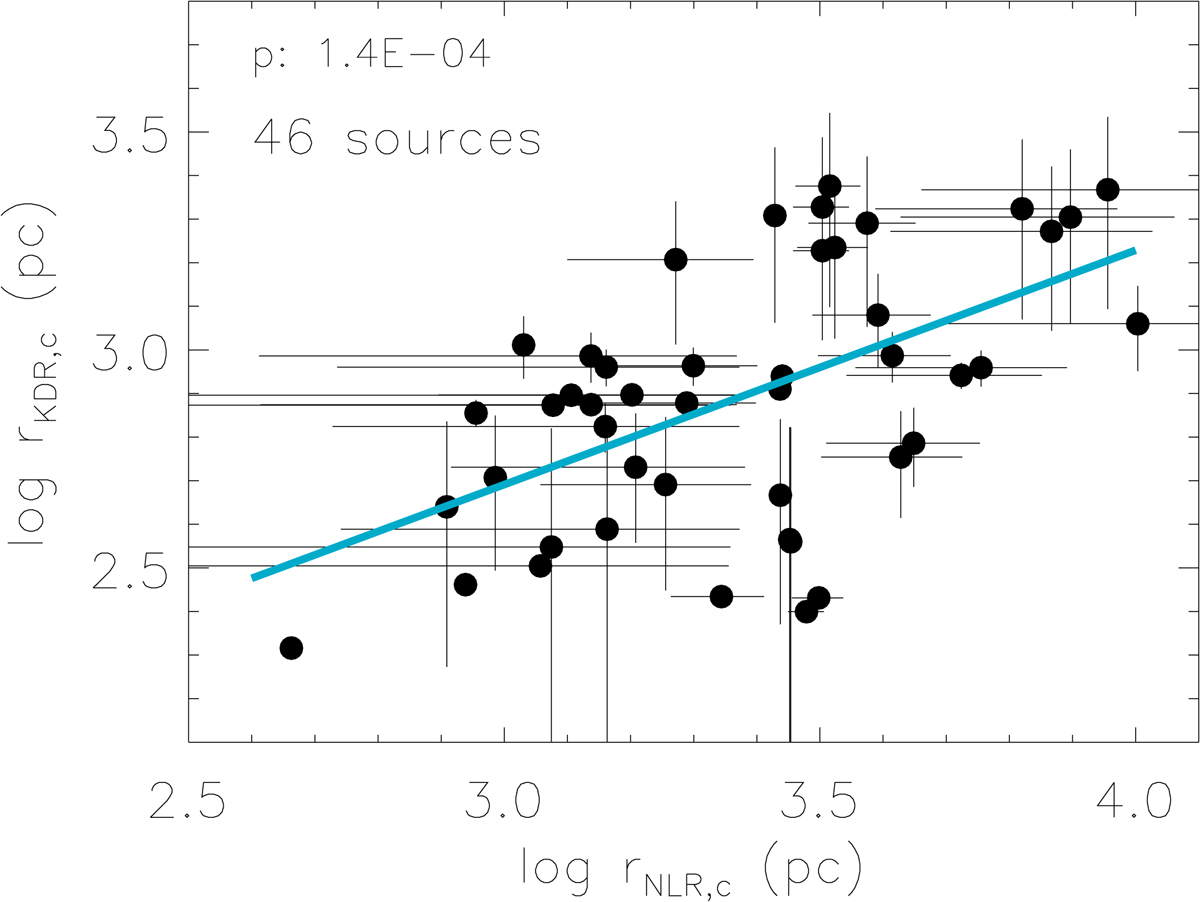
Fig. 10.
Download original image
KDR extents versus NLR extents on a logarithmic scale. There is a correlation between these extents, with a Spearman correlation coefficient of CC ∼ 0.53 and a p-value of 10−4. The best-fit linear regression (blue line) results in an intercept of ∼1.07 ± 0.22 and a slope of ∼0.53 ± 0.12. The uncertainties are represented by grey bars corresponding to differences in the value of the properties of 1σ.
Current usage metrics show cumulative count of Article Views (full-text article views including HTML views, PDF and ePub downloads, according to the available data) and Abstracts Views on Vision4Press platform.
Data correspond to usage on the plateform after 2015. The current usage metrics is available 48-96 hours after online publication and is updated daily on week days.
Initial download of the metrics may take a while.