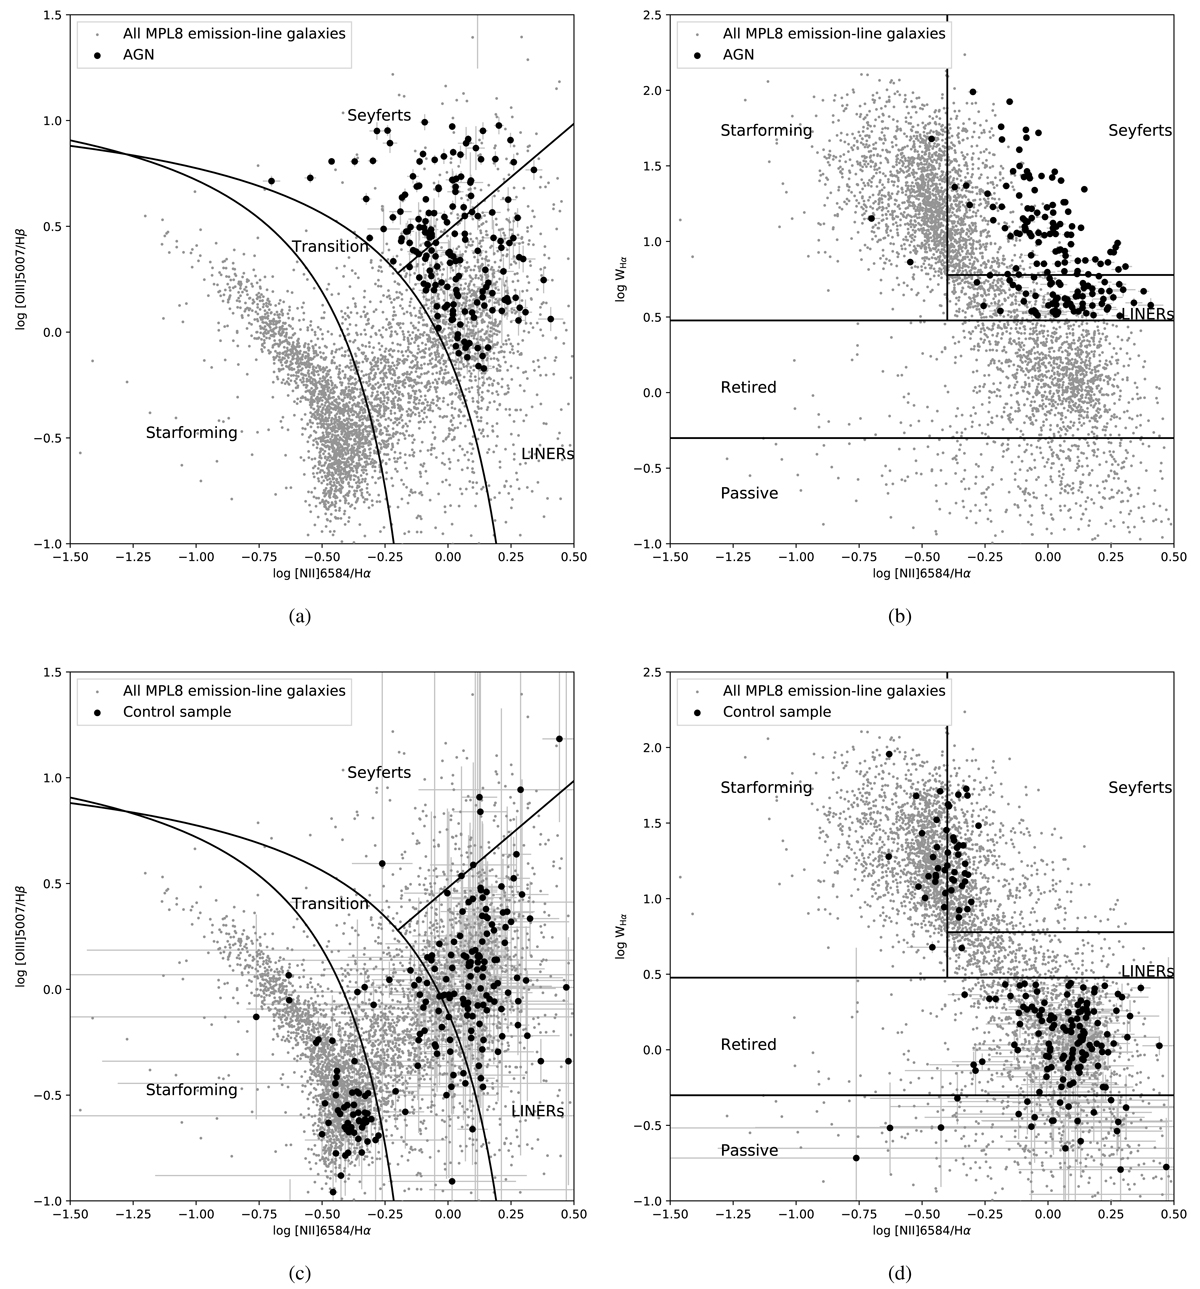
Fig. 1.
Download original image
BPT (left) and WHAN (right) diagrams for the AGN hosts (top) and control objects (bottom) in our sample. The separating lines in the plots are from Kauffmann et al. (2003), Kewley et al. (2001), and Cid Fernandes et al. (2010). Grey dots represent all the emission-line galaxies in MPL-8. Large black circles represent AGNs and control objects.
Current usage metrics show cumulative count of Article Views (full-text article views including HTML views, PDF and ePub downloads, according to the available data) and Abstracts Views on Vision4Press platform.
Data correspond to usage on the plateform after 2015. The current usage metrics is available 48-96 hours after online publication and is updated daily on week days.
Initial download of the metrics may take a while.