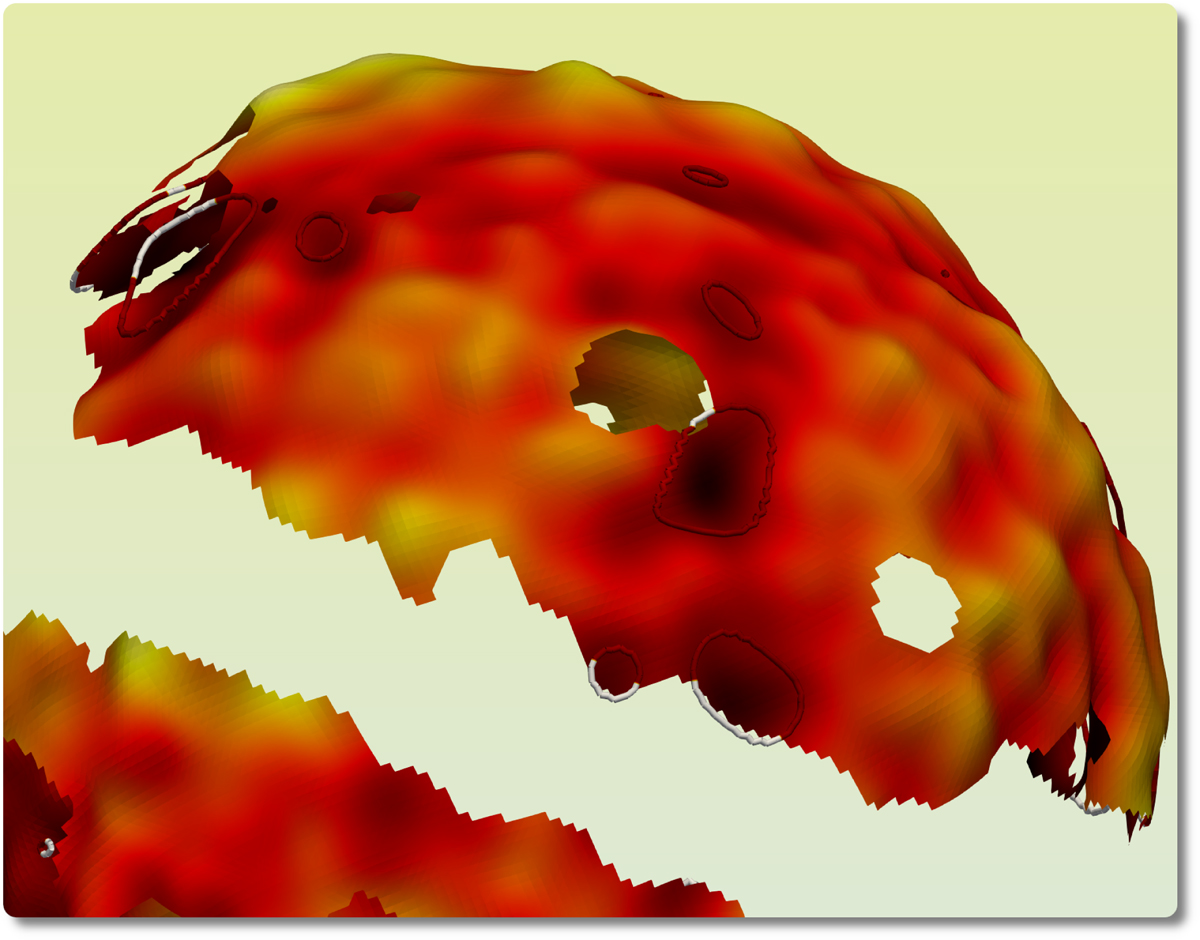
Fig. 8.
Download original image
Visualization of the loops surrounding the low-density regions at a moderately negative threshold. The gaps in the manifold correspond to the mask that has been removed. We clearly note the equatorial belt corresponding to our galaxy, and more patches in the visible cap. Some loops live fully in the excursion region that is not influenced by the mask. We show them in red. We also depict some representative relative loops whose end points are masked. We draw closed loops for this category as well and show the portions in which they overlap the masked regions in white. The visualization is based on the observed CMB map from the NPIPE data set smoothed at 5 degrees.
Current usage metrics show cumulative count of Article Views (full-text article views including HTML views, PDF and ePub downloads, according to the available data) and Abstracts Views on Vision4Press platform.
Data correspond to usage on the plateform after 2015. The current usage metrics is available 48-96 hours after online publication and is updated daily on week days.
Initial download of the metrics may take a while.