Open Access
Fig. 7.
Download original image
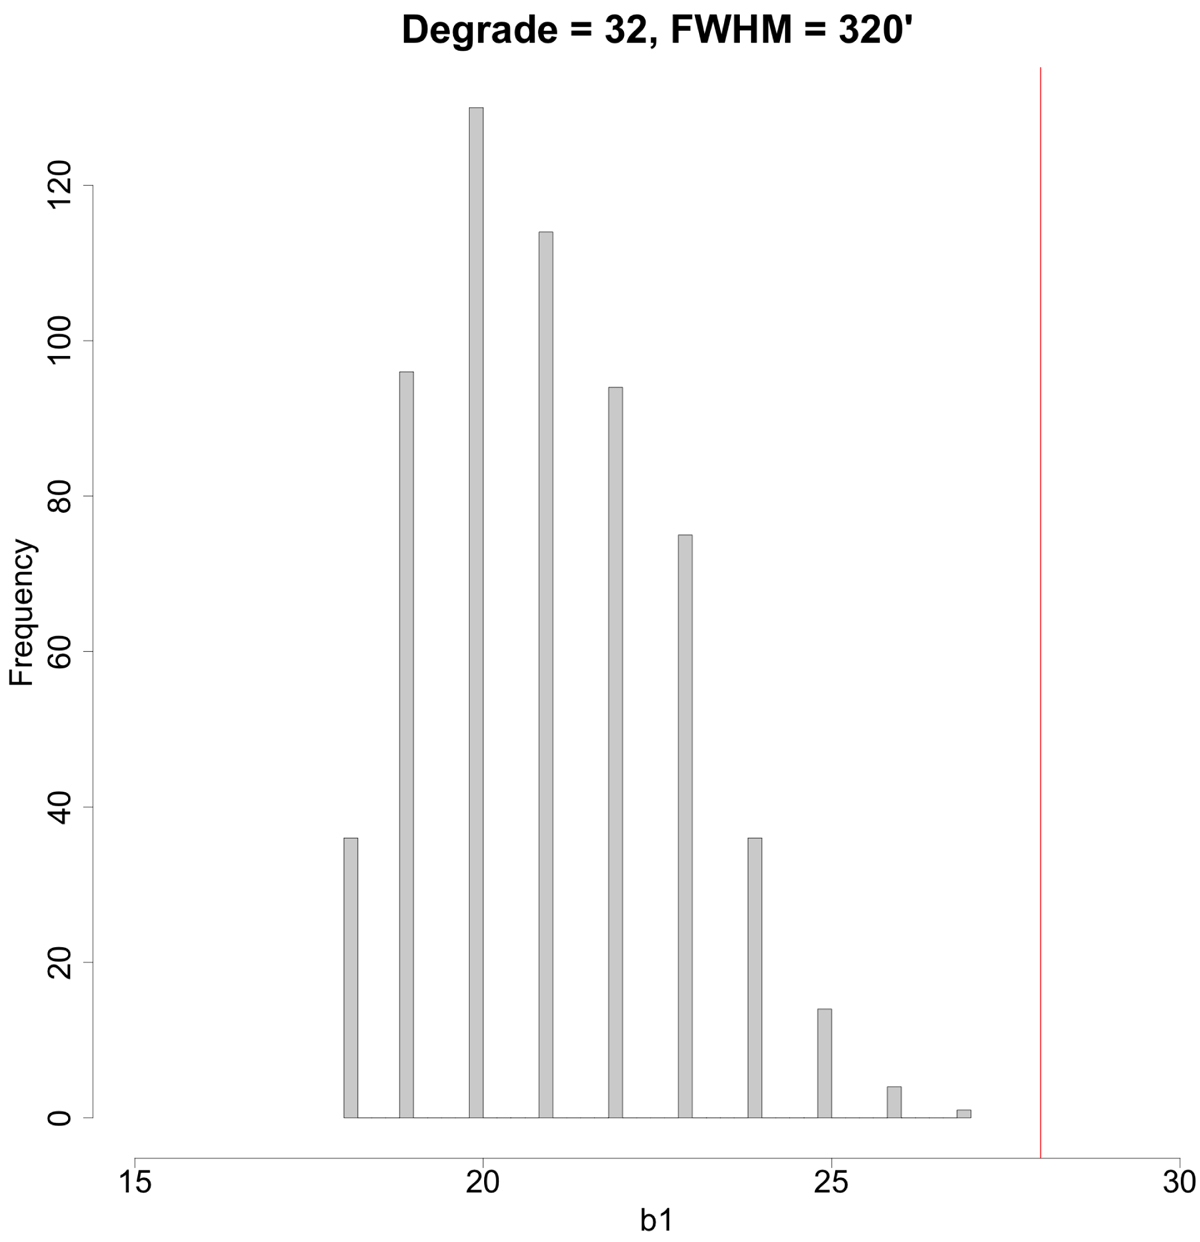
Histogram of b1 at ν = −2.5, where the ∼4σ deviation occurs. The minimum value attained across 600 simulations is 18, with a mean at ∼21 and a standard deviation of ∼1.7. The observed map exhibits b1 = 28 and is well outside the distribution.
Current usage metrics show cumulative count of Article Views (full-text article views including HTML views, PDF and ePub downloads, according to the available data) and Abstracts Views on Vision4Press platform.
Data correspond to usage on the plateform after 2015. The current usage metrics is available 48-96 hours after online publication and is updated daily on week days.
Initial download of the metrics may take a while.