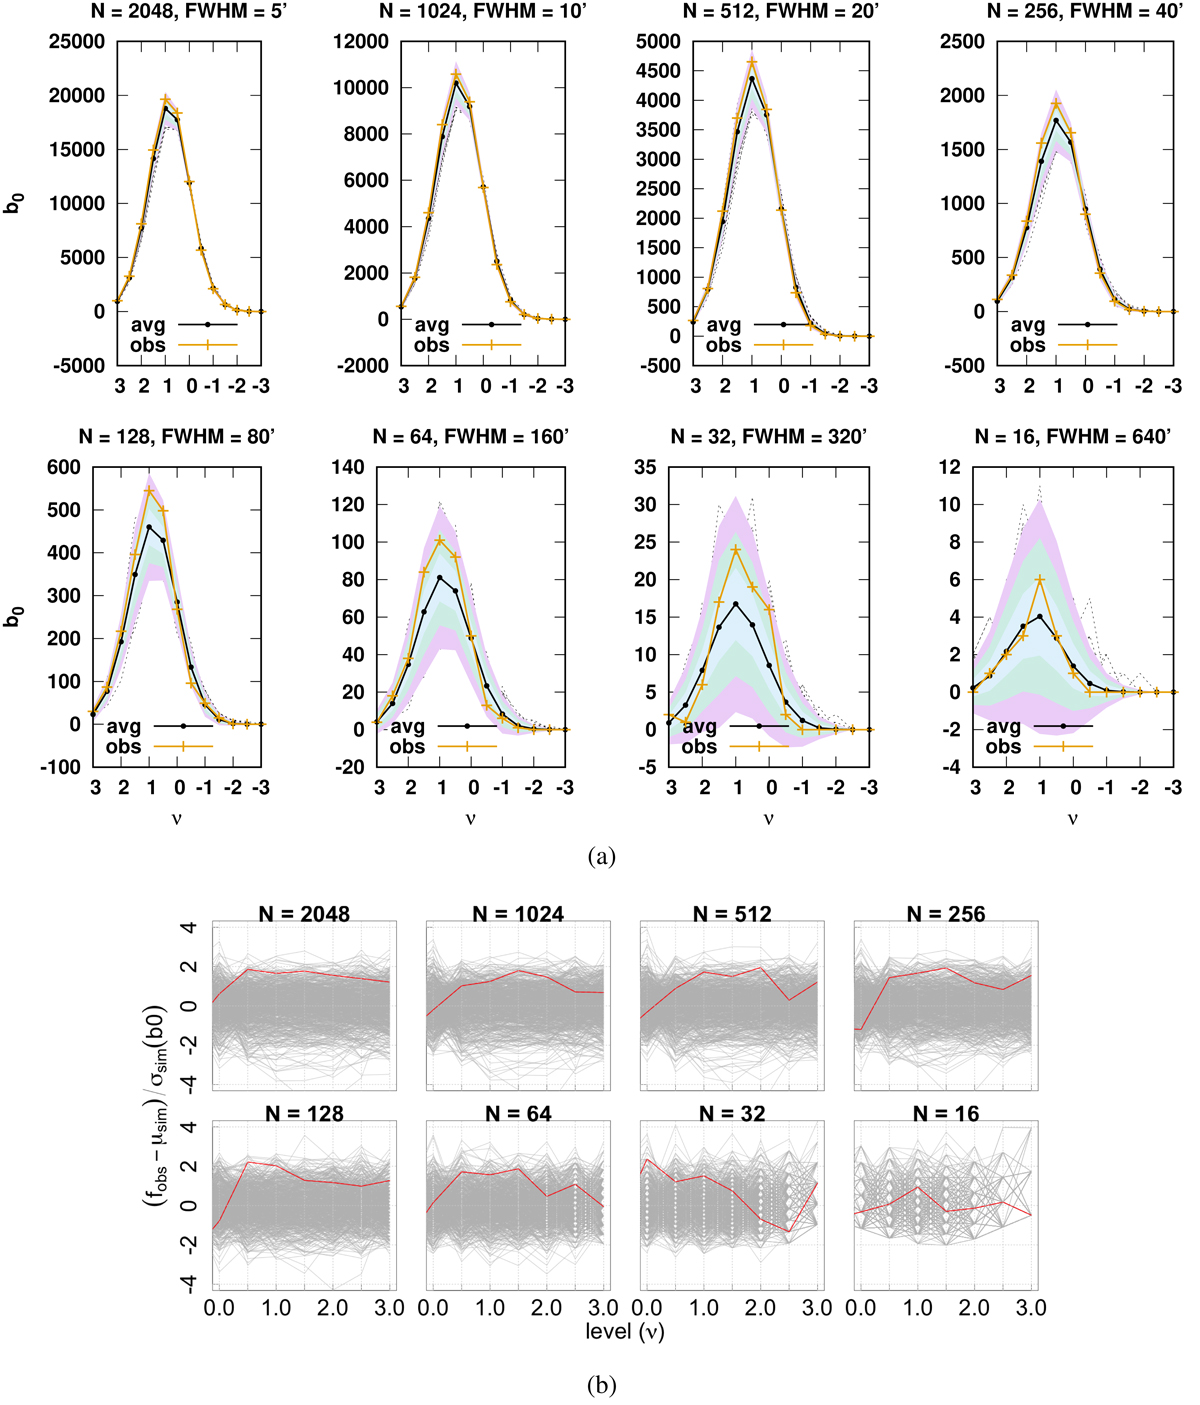
Fig. 4.
Download original image
Graphs of b0 for the NPIPE dataset for various degraded and smoothing scales. Panel a: observational curve in yellow, and the curves corresponding to the average of simulations are presented in gray. Error bands corresponding to (1σ : 3σ) are also drawn. Panel b: curve for the significance of the differences, where the observed curves are presented in red, and the values for the simulations are presented as dotted gray lines.
Current usage metrics show cumulative count of Article Views (full-text article views including HTML views, PDF and ePub downloads, according to the available data) and Abstracts Views on Vision4Press platform.
Data correspond to usage on the plateform after 2015. The current usage metrics is available 48-96 hours after online publication and is updated daily on week days.
Initial download of the metrics may take a while.