Fig. 3.
Download original image
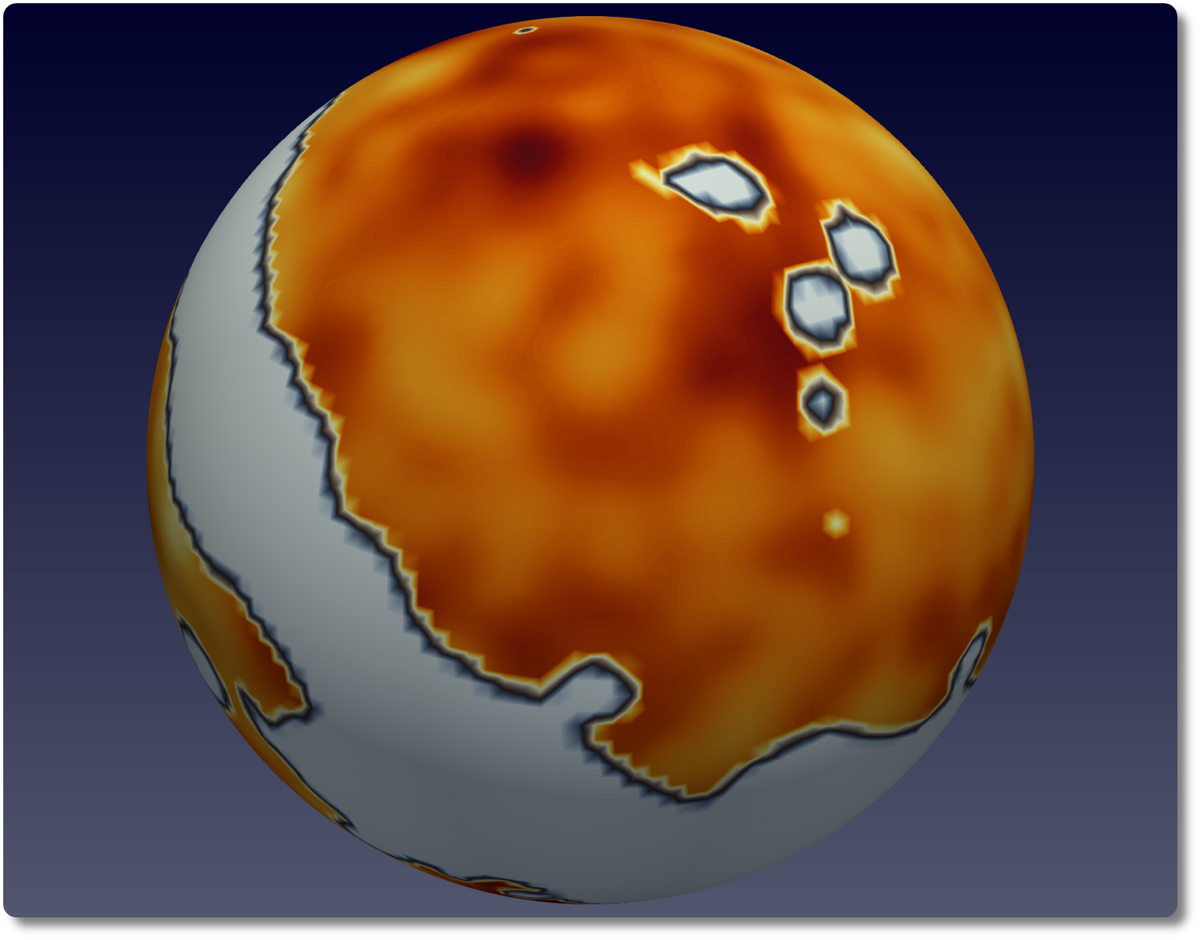
Visualization of the temperature fluctuations in the CMB sky in the presence of masks (plotted in gray). It consists of an equatorial belt and numerous patches on the northern and southern cap, which correspond to our galaxy and other bright foreground objects. The visualization is based on the observed CMB sky cleaned by the NPIPE pipeline and smoothed at 5 degrees.
Current usage metrics show cumulative count of Article Views (full-text article views including HTML views, PDF and ePub downloads, according to the available data) and Abstracts Views on Vision4Press platform.
Data correspond to usage on the plateform after 2015. The current usage metrics is available 48-96 hours after online publication and is updated daily on week days.
Initial download of the metrics may take a while.