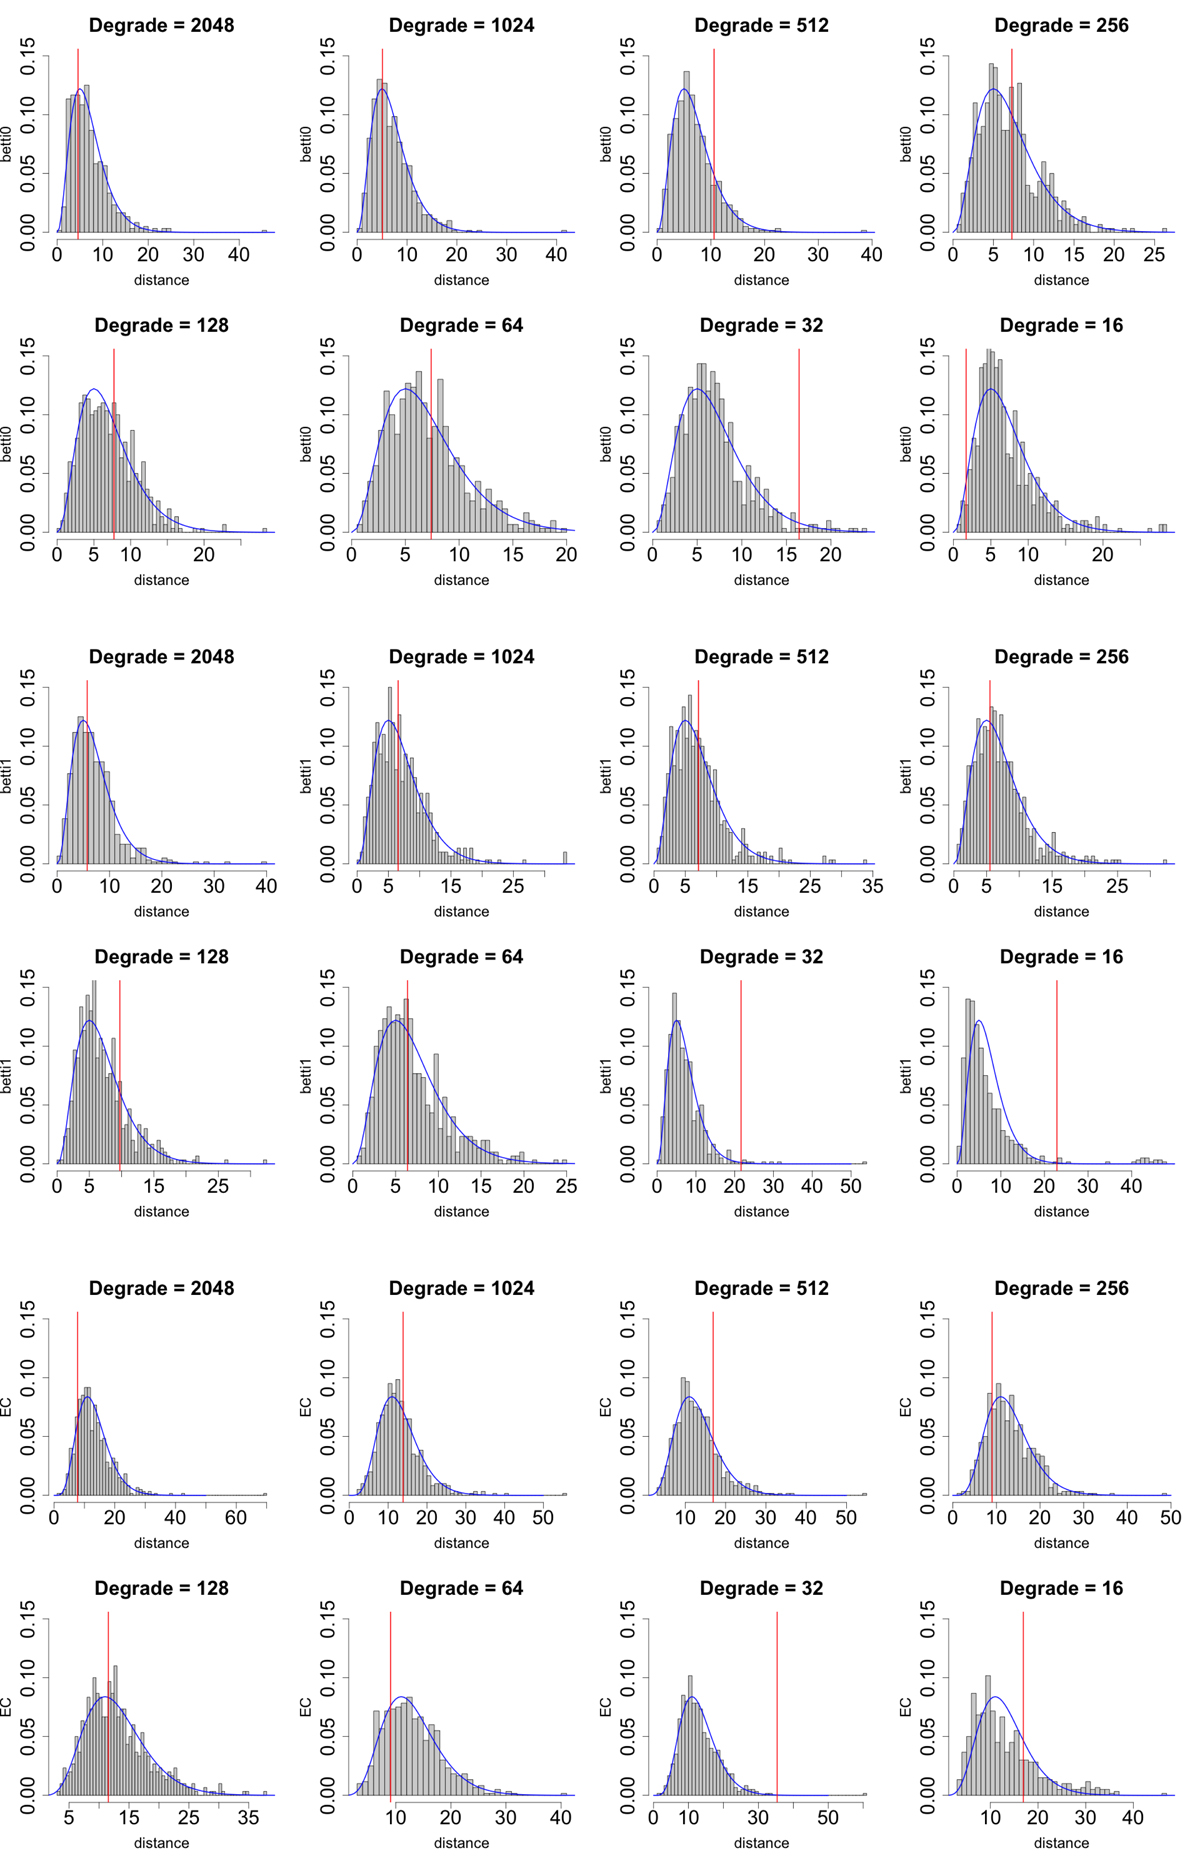
Fig. C.1.
Download original image
Distribution of the Mahalanobis distance. The box histograms present the distribution of the Mahalanobis distance of the simulations with respect to the mean. The blue curve plots the theoretical χ2 distribution for the given degrees of freedom, and the red vertical line presents the Mahalanobis distance of the observation with respect to mean. The generally good fit of the theoretical curve with the histogram of the simulations for all resolutions lends credibility to the validity of the statistical tests in the chosen regimes.
Current usage metrics show cumulative count of Article Views (full-text article views including HTML views, PDF and ePub downloads, according to the available data) and Abstracts Views on Vision4Press platform.
Data correspond to usage on the plateform after 2015. The current usage metrics is available 48-96 hours after online publication and is updated daily on week days.
Initial download of the metrics may take a while.