Fig. A.2.
Download original image
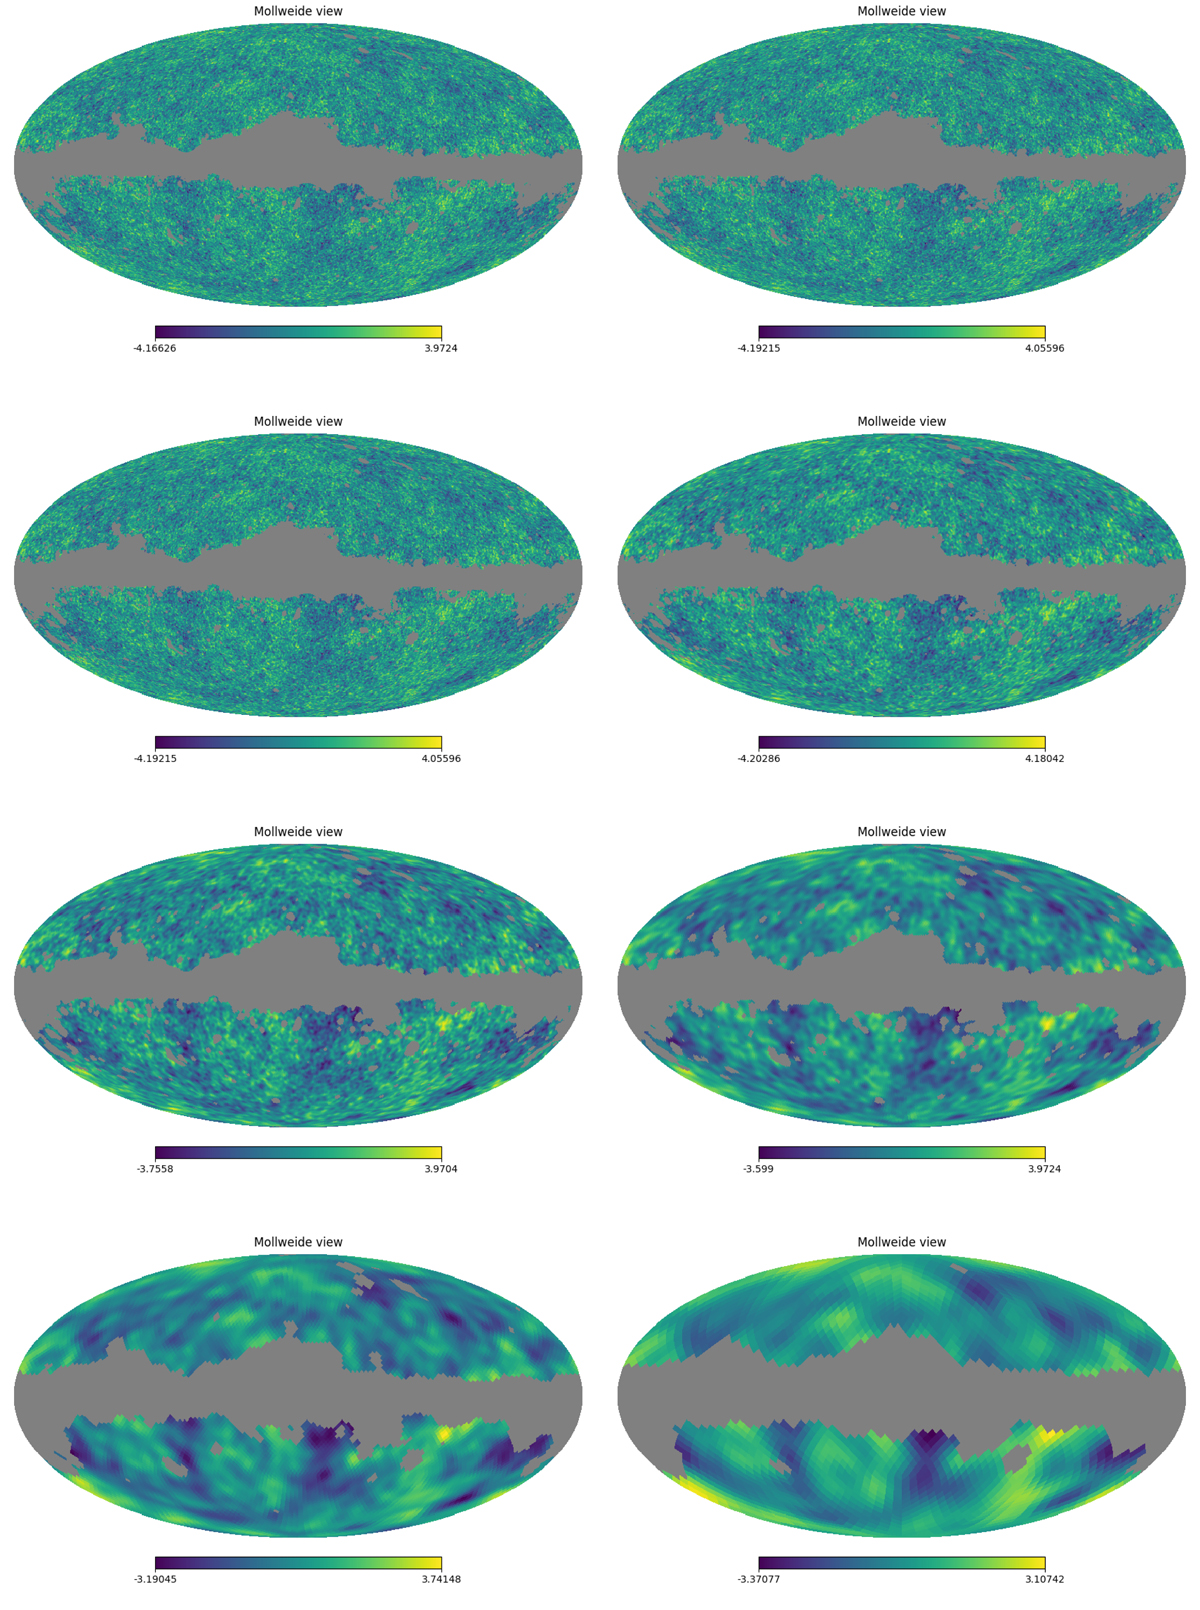
Visualization of the degraded, smoothed, and masked observational maps employed in this paper. The maps are degraded at N = 2048, 1024, 512, 256, 128, 64, 32, and 16, and smoothed at FWHM = 5′,10′,20′,40′,80′,160′,320′,and 640′, respectively. The mask is degraded and smoothed at the same scales as the map, and subsequently thresholded at 0.9 for rebinarization.
Current usage metrics show cumulative count of Article Views (full-text article views including HTML views, PDF and ePub downloads, according to the available data) and Abstracts Views on Vision4Press platform.
Data correspond to usage on the plateform after 2015. The current usage metrics is available 48-96 hours after online publication and is updated daily on week days.
Initial download of the metrics may take a while.