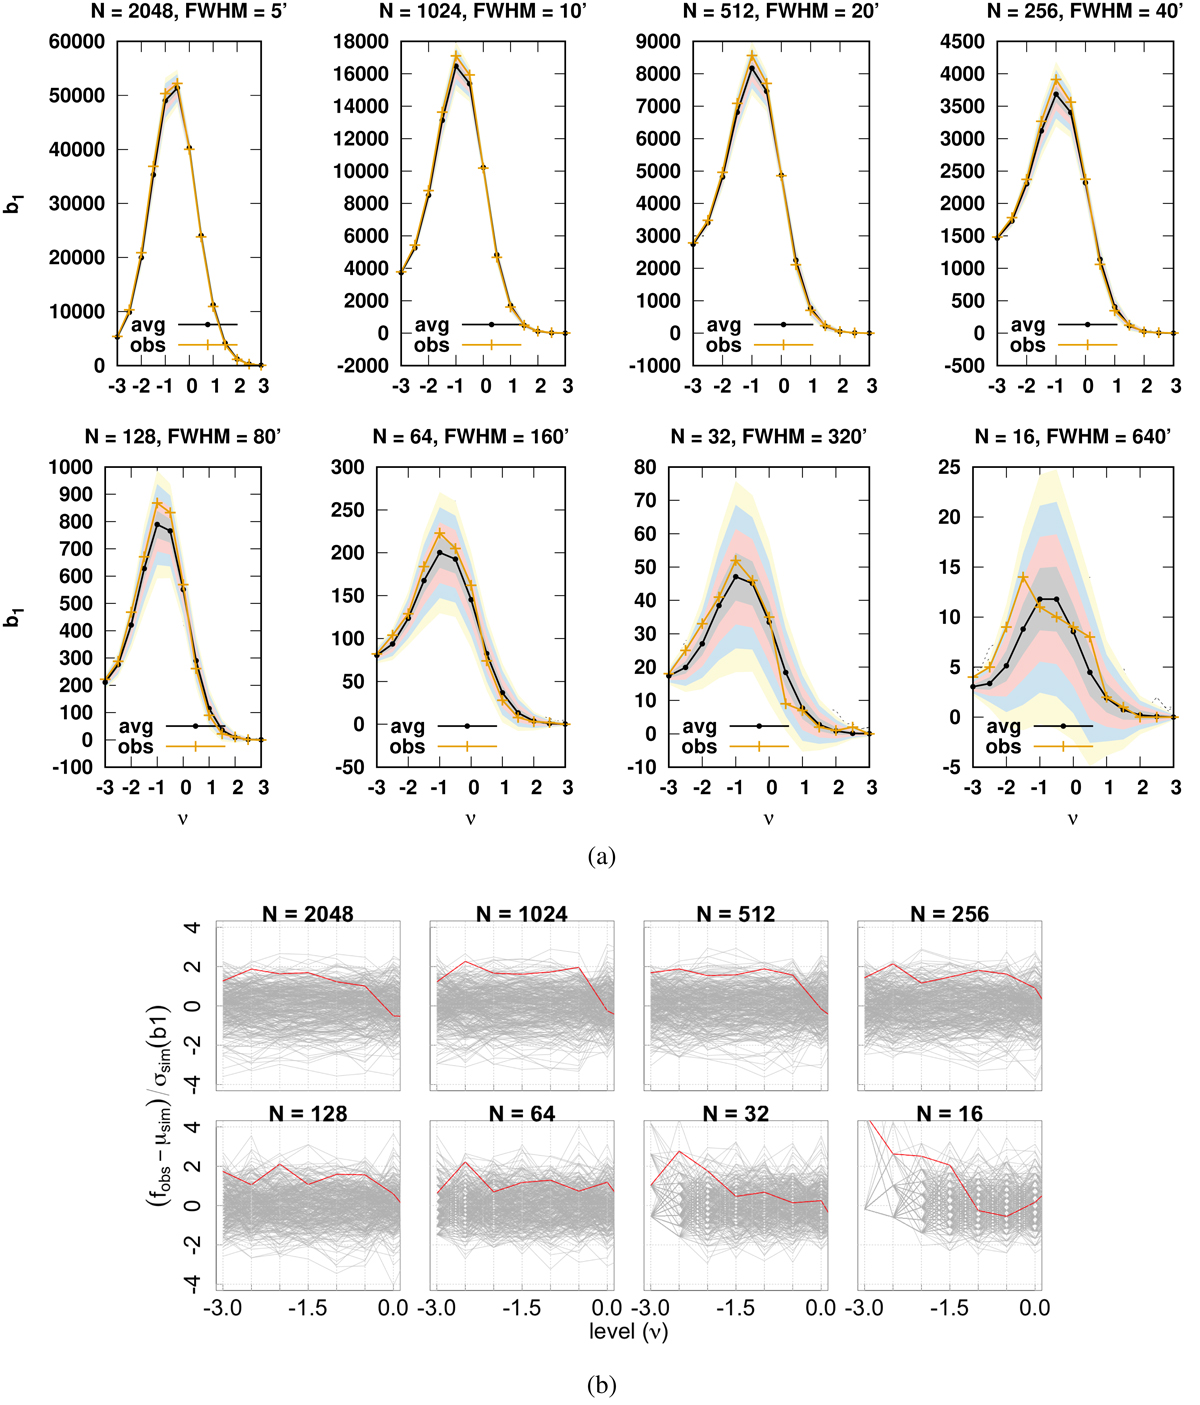
Fig. 11.
Download original image
Graph of b1 for the FFP10 dataset. In panel a, the observational curves are presented in yellow, and the curves corresponding to the average of simulations are presented in gray. Error bands corresponding to (1σ : 4σ) are also drawn. Panel b: significance of the differences. The dataset exhibits milder deviations than the NPIPE dataset in general, but there are mildly significant deviations at 2.77σ, at scales and thresholds where the NPIPE dataset shows strong deviations as well.
Current usage metrics show cumulative count of Article Views (full-text article views including HTML views, PDF and ePub downloads, according to the available data) and Abstracts Views on Vision4Press platform.
Data correspond to usage on the plateform after 2015. The current usage metrics is available 48-96 hours after online publication and is updated daily on week days.
Initial download of the metrics may take a while.