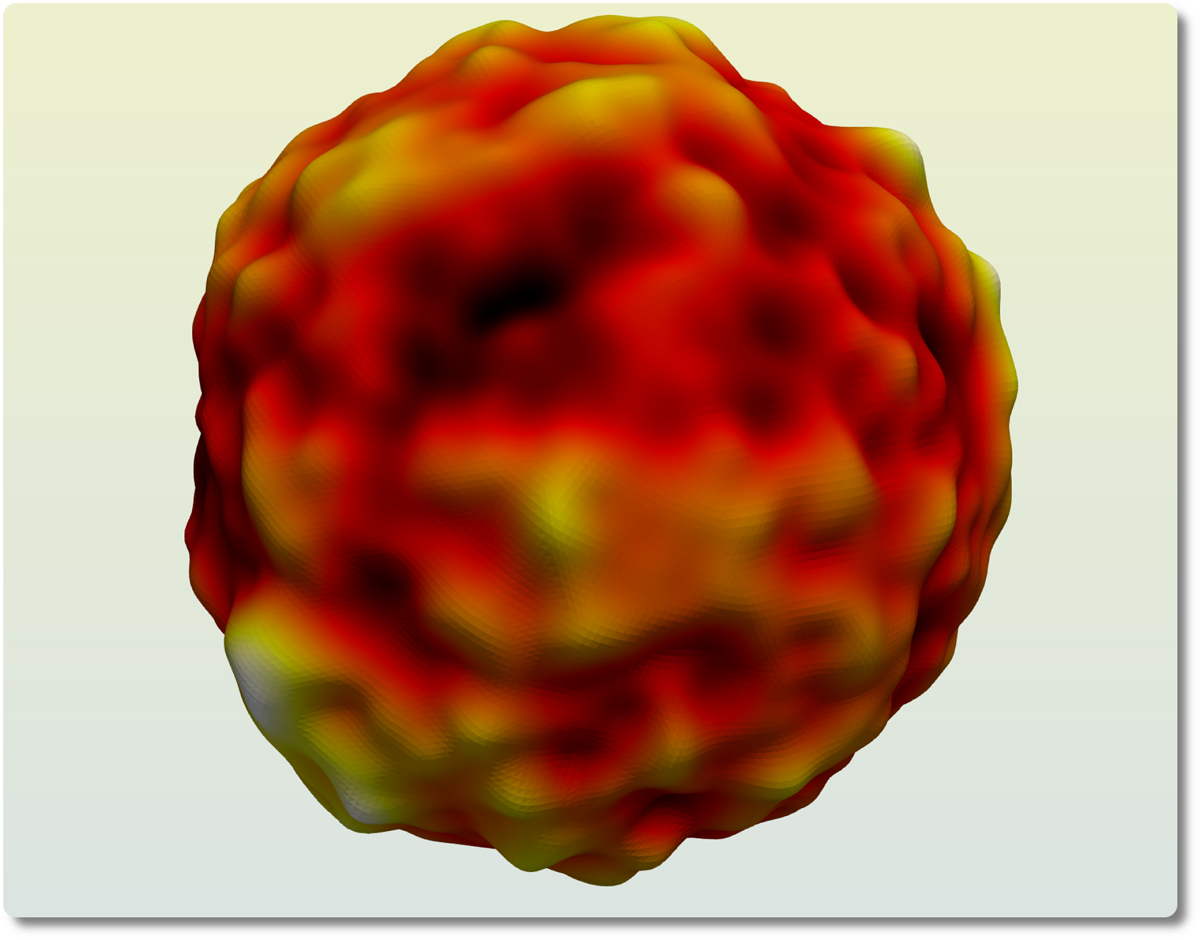
Fig. 1.
Download original image
Visualization of the temperature fluctuations in the CMB sky. The survey surface 𝕊2 is distorted at each point in the direction of the surface normal. The distortion is proportional to the fluctuation in direction and magnitude. The visualization is based on the observed CMB sky cleaned by the NPIPE pipeline and smoothed at 5 degrees.
Current usage metrics show cumulative count of Article Views (full-text article views including HTML views, PDF and ePub downloads, according to the available data) and Abstracts Views on Vision4Press platform.
Data correspond to usage on the plateform after 2015. The current usage metrics is available 48-96 hours after online publication and is updated daily on week days.
Initial download of the metrics may take a while.