Fig. 5
Download original image
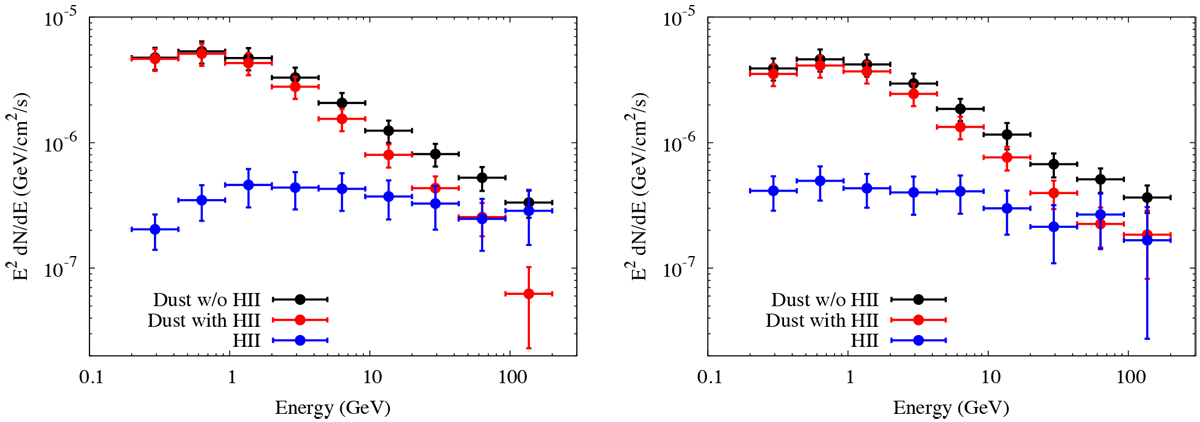
SEDs of diffuse γ-ray emissions associated with different components for region I (left panel) and region II (right panel). The black and red points show the γ rays associated with total gas (the dust template) for both dust models and dust+H II models, respectively. The blue points represent the γ rays related to H II gas (the H II template) obtained for dust+H II models.
Current usage metrics show cumulative count of Article Views (full-text article views including HTML views, PDF and ePub downloads, according to the available data) and Abstracts Views on Vision4Press platform.
Data correspond to usage on the plateform after 2015. The current usage metrics is available 48-96 hours after online publication and is updated daily on week days.
Initial download of the metrics may take a while.