Fig. A.1
Download original image
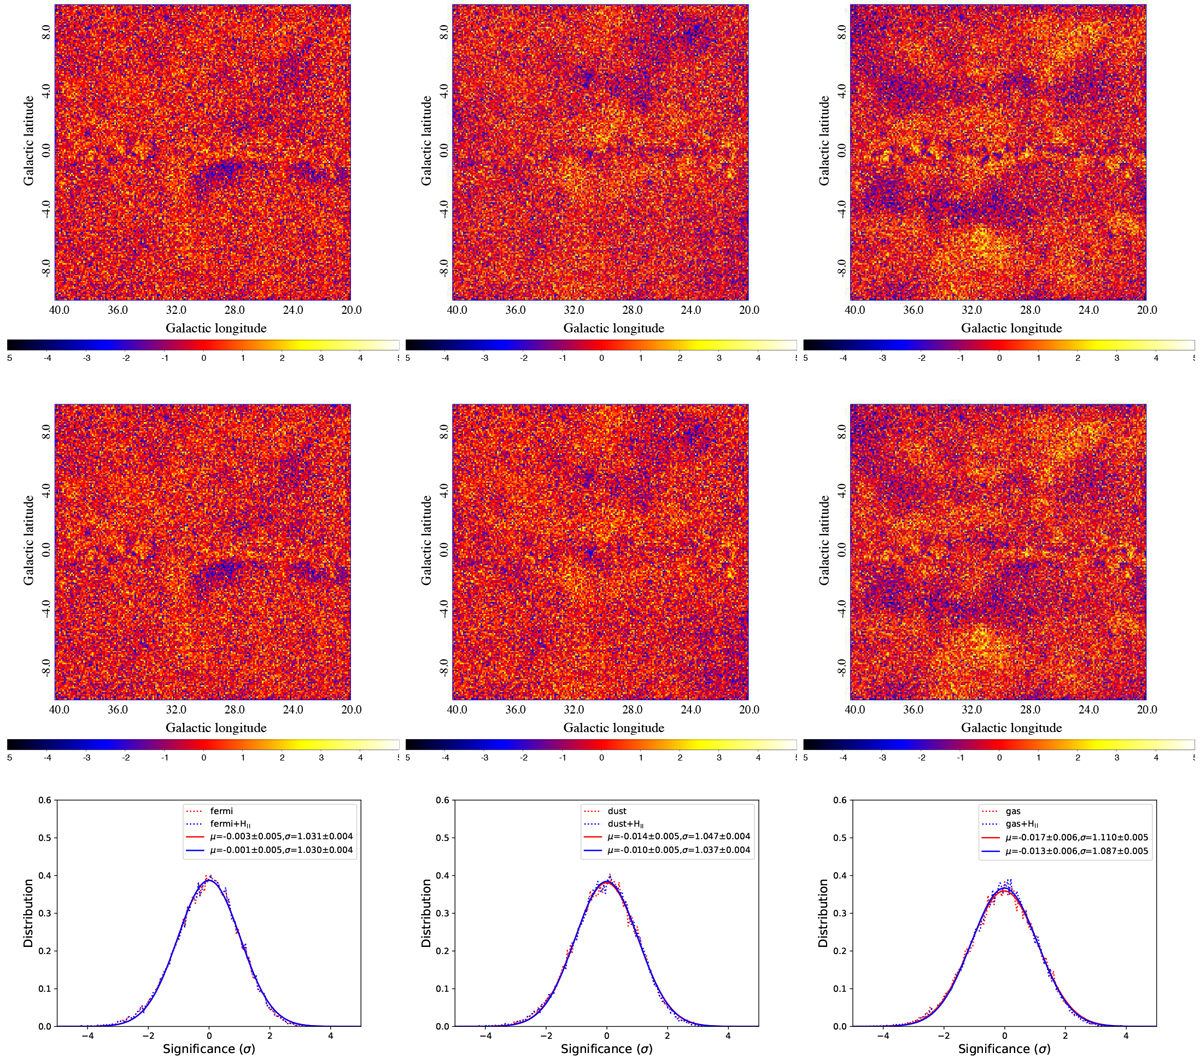
Comparison of the residual significance (signal-to-noise, S/N) maps in the energy range of 0.2–200 GeV for models without an H II component (top) and with an H II component (middle) of region I. The left panels show the results of Fermi and Fermi+H II models, the middle panels show the results of dust and dust+H II models, and the right panels illustrate the results of gas and gas+H II models. The color scales are from − 5σ to 5σ. The bottom panel show the distribution of significance (bin size is 0.05 σ of each model without or without the HII component, in which each solid line illustrates the Gaussian function fitted to the corresponding distribution and μ and σ represent the mean and the standard deviation of each fit.
Current usage metrics show cumulative count of Article Views (full-text article views including HTML views, PDF and ePub downloads, according to the available data) and Abstracts Views on Vision4Press platform.
Data correspond to usage on the plateform after 2015. The current usage metrics is available 48-96 hours after online publication and is updated daily on week days.
Initial download of the metrics may take a while.