Fig. 5.
Download original image
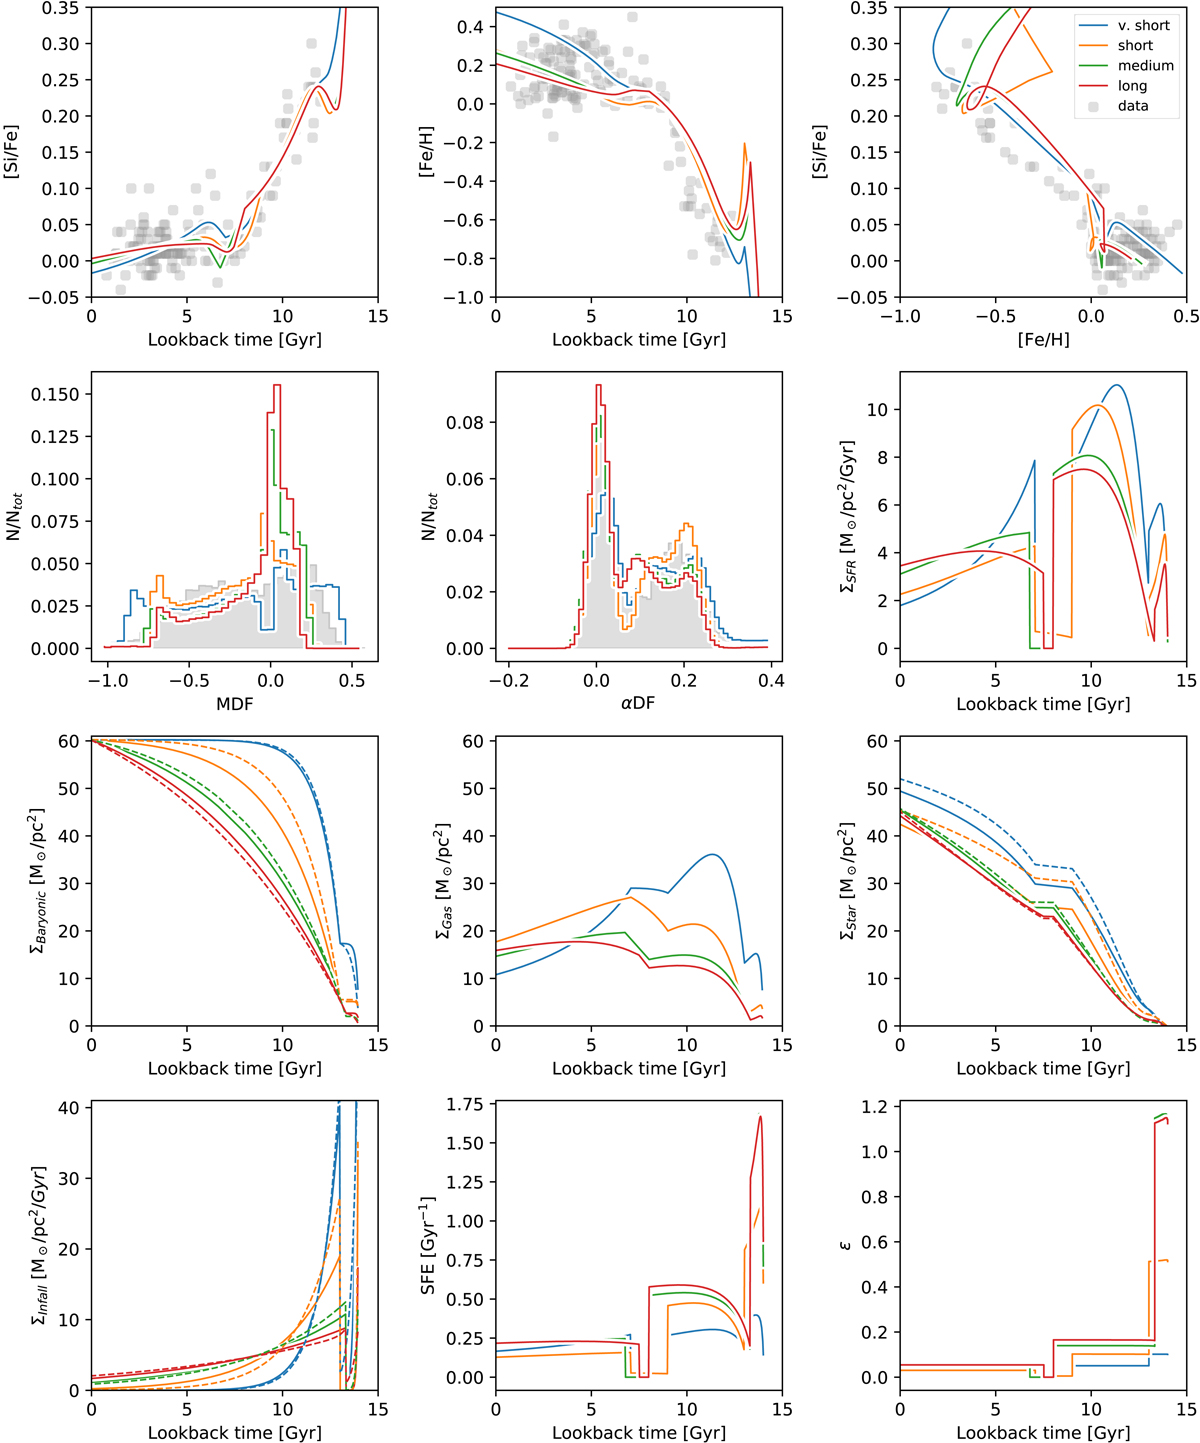
Fits of the exponential infall to the time–[Si/Fe] distribution (ωMDF, αDF = 0). Top row, from left to right: best-fit time–[Si/Fe] used to fit the data, the time–metallicity distribution, and the abundance–metallicity distribution. In each panel, the points show the data. Second row: MDF, αDF, and the recovered SFH. The grey histograms show the distribution functions for the inner disc in APOGEE. Third row: evolution of the baryonic mass, gas mass and stellar mass over time. Fourth row: infall rate, and the evolution of the SFE and ϵ. The different lines are for different initial conditions, and the dashed lines show the evolution of those unfitted initial states.
Current usage metrics show cumulative count of Article Views (full-text article views including HTML views, PDF and ePub downloads, according to the available data) and Abstracts Views on Vision4Press platform.
Data correspond to usage on the plateform after 2015. The current usage metrics is available 48-96 hours after online publication and is updated daily on week days.
Initial download of the metrics may take a while.