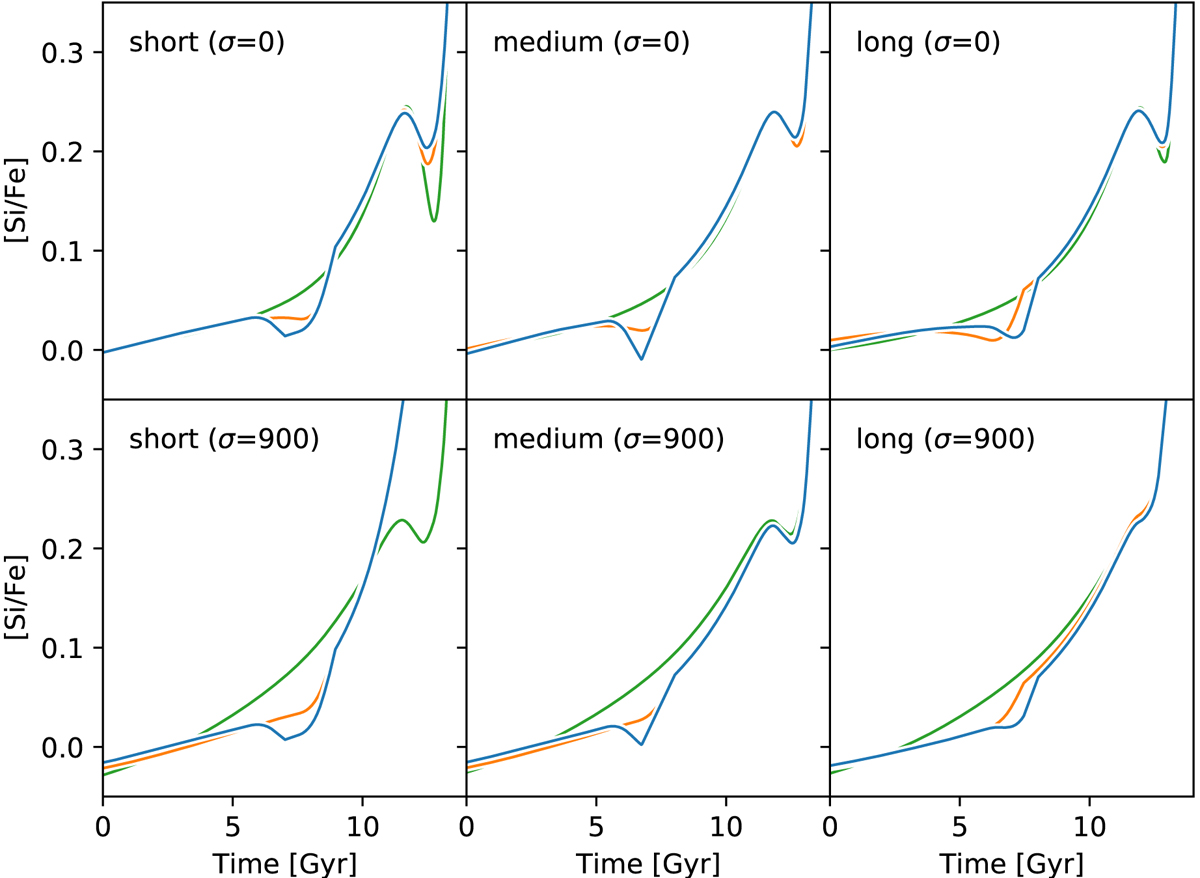
Fig. A.1.
Download original image
Different star formation histories fitted using different initial star formation histories. The blue line shows the [Si/Fe]–time evolutions from Sect. 4.1. The orange lines show the [Si/Fe]–time evolution with the explicit quenching removed, and the green line shows the result when the late-time thin disc ϵ is set to be the same as the thick disc ϵ.
Current usage metrics show cumulative count of Article Views (full-text article views including HTML views, PDF and ePub downloads, according to the available data) and Abstracts Views on Vision4Press platform.
Data correspond to usage on the plateform after 2015. The current usage metrics is available 48-96 hours after online publication and is updated daily on week days.
Initial download of the metrics may take a while.