Fig. 11.
Download original image
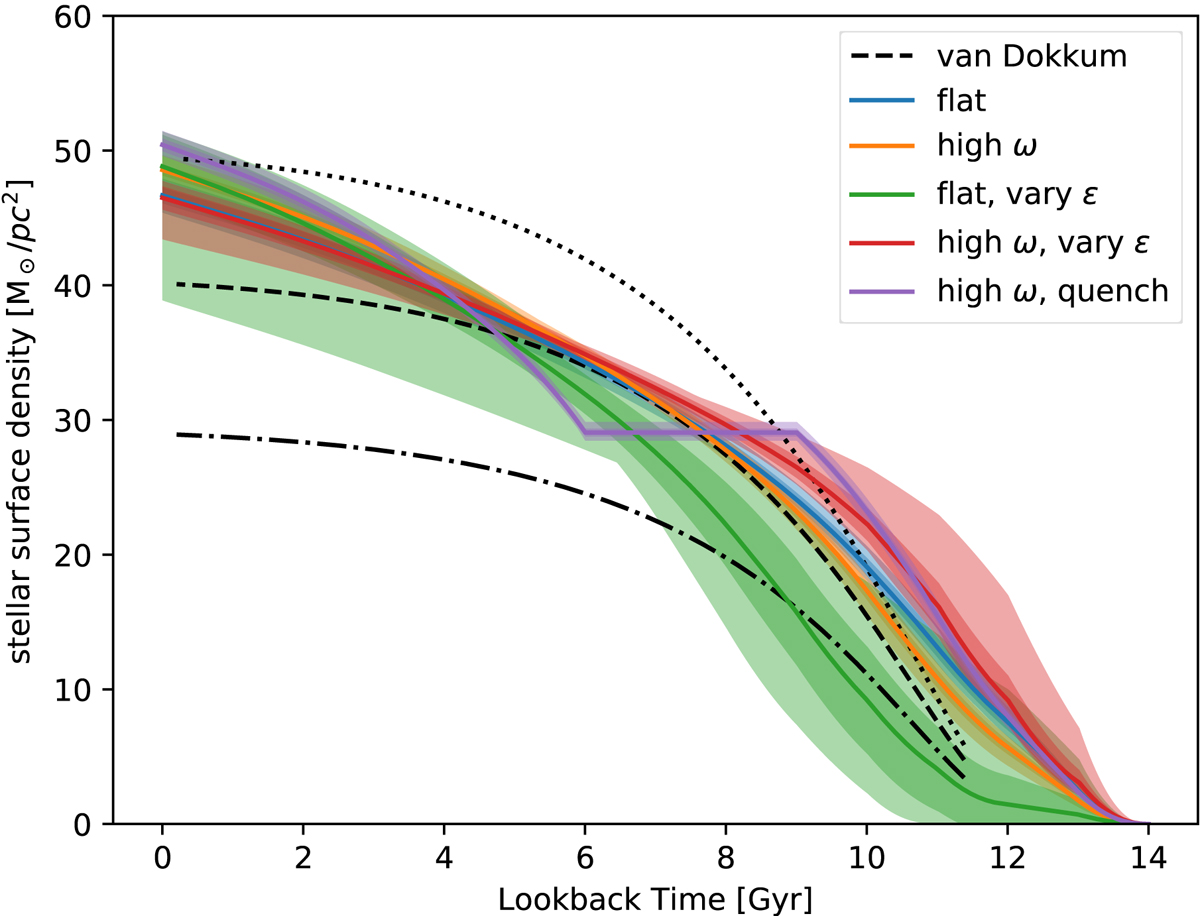
Comparison between the models with the average stellar mass growth from van Dokkum et al. (2013). The models used here use free infall and high ω. We also show the median line of 24 runs where we bootstrapped the data. The variation from the minimum value to maximum value in each time-step is shown as the light coloured region around each line. ± the standard deviation is shown as the darker coloured region around each line. The black lines show how different values of the disc radial scale length –used to convert the stellar mass to the local stellar surface density– affect the van Dokkum et al. (2013) fit. The dotted line, dashed line and dot-dash line use Rscale = 2.1, 2.4, 1.8 kpc. These values are taken from Porcel et al. (1998).
Current usage metrics show cumulative count of Article Views (full-text article views including HTML views, PDF and ePub downloads, according to the available data) and Abstracts Views on Vision4Press platform.
Data correspond to usage on the plateform after 2015. The current usage metrics is available 48-96 hours after online publication and is updated daily on week days.
Initial download of the metrics may take a while.