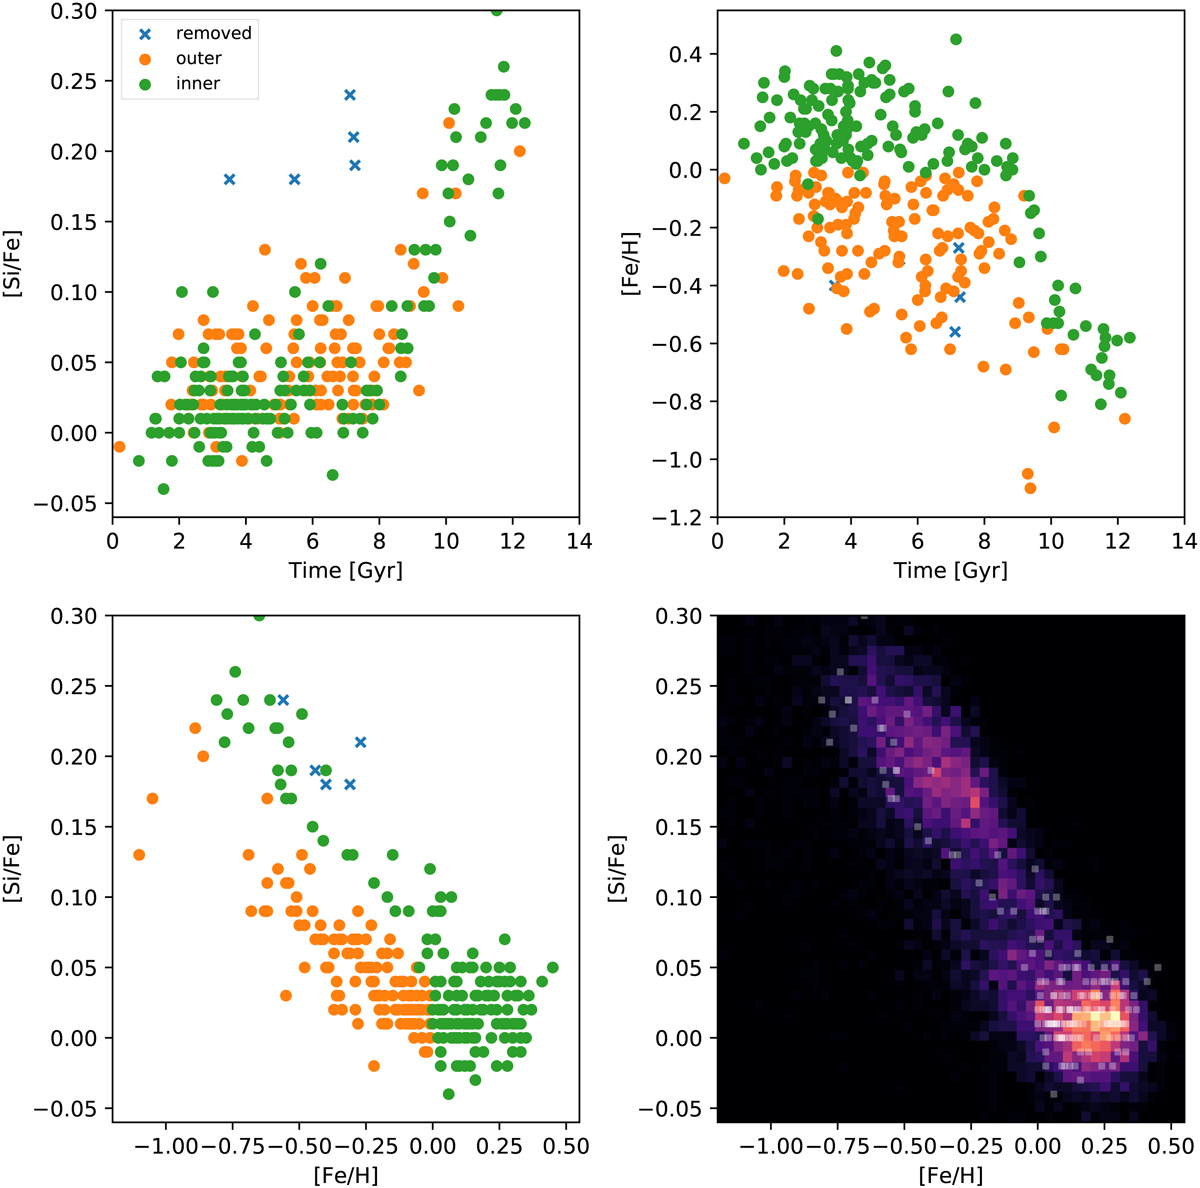
Fig. 1.
Download original image
Chemical and age distribution of stars from spectroscopic surveys. Top row and bottom left panel: decomposition of the chemistry–age distribution of stars from Delgado Mena et al. (2017) with ages by Haywood et al. (in prep.) Top row and bottom left panel: stars are coloured according to whether they are part of the inner or outer disc. Several young alpha-rich stars (Haywood et al. 2013) shown in blue are removed from the sample. Bottom right panel: distribution of inner disc stars taken from APOGEE, with the inner disc stars from Adibekyan et al. (2012) and Delgado Mena et al. (2017) plotted as white points.
Current usage metrics show cumulative count of Article Views (full-text article views including HTML views, PDF and ePub downloads, according to the available data) and Abstracts Views on Vision4Press platform.
Data correspond to usage on the plateform after 2015. The current usage metrics is available 48-96 hours after online publication and is updated daily on week days.
Initial download of the metrics may take a while.