| Issue |
A&A
Volume 658, February 2022
|
|
|---|---|---|
| Article Number | L5 | |
| Number of page(s) | 6 | |
| Section | Letters to the Editor | |
| DOI | https://doi.org/10.1051/0004-6361/202142791 | |
| Published online | 04 February 2022 | |
Letter to the Editor
Non-star-forming molecular gas in the Abell 1367 intra-cluster multiphase orphan cloud⋆
1
Astronomical Institute of the Czech Academy of Sciences, Boční II 1401, 141 00 Prague, Czech Republic
e-mail: This email address is being protected from spambots. You need JavaScript enabled to view it.
2
Department of Physics and Astronomy, University of Alabama in Huntsville, Huntsville, AL 35899, USA
3
National Astronomical Observatory of Japan, 2-21-1, Osawa, Mitaka, Tokyo 181-8588, Japan
4
Observatoire de Paris, LERMA, Collège de France, CNRS, PSL University, Sorbonne University, 75014 Paris, France
5
Department of Astronomy, Yale University, 46 Hillhouse Avenue, New Haven, CT 06511, USA
6
Institute of Astrophysics and Space Sciences (IA), Rua das Estrelas, 4150-762 Porto, Portugal
7
Centre for Astrophysics Research, University of Hertfordshire, College Lane, Hatfield AL10 9AB, UK
Received:
30
November
2021
Accepted:
17
January
2022
Abstract
We report the detection of CO emission in the recently discovered multiphase isolated gas cloud in the nearby galaxy cluster Abell 1367. The cloud is located about 800 kpc in projection from the center of the cluster and at a projected distance of > 80 kpc from any galaxy. It is the first and the only known isolated “intra-cluster” cloud detected in X-ray, Hα, and CO emission. We found a total of about 2.2 × 10⁸ M⊙ of H2 with the IRAM 30-m telescope in two regions, one associated with the peak of Hα emission and another with the peak of X-ray emission surrounded by weak Hα filaments. The velocity of the molecular gas is offset from the underlying Hα emission by > 100 km s−1 in the region where the X-ray peaks. The molecular gas may account for about 10% of the total cloud’s mass, which is dominated by the hot X-ray component. The previously measured upper limit on the star formation rate in the cloud indicates that the molecular component is in a non-star-forming state, possibly due to a combination of low density of the gas and the observed level of velocity dispersion. The presence of the three gas phases associated with the cloud suggests that gas phase mixing with the surrounding intra-cluster medium is taking place. The possible origin of the orphan cloud is a late evolutionary stage of a ram pressure stripping event. In contrast, the nearby ram pressure stripped galaxy 2MASX J11443212+2006238 is in an early phase of stripping and we detected about 2.4 × 10⁹ M⊙ of H2 in its main body.
Key words: galaxies: clusters: individual: Abell 1367 / galaxies: clusters: intracluster medium / galaxies: ISM / galaxies: star formation / submillimeter: ISM / galaxies: individual: 2MASX J11443212+2006238
Based on observations carried out under project number 077-21 with the Institut de Radio Astronomie Millimétrique (IRAM) 30-meter telescope. IRAM is supported by INSU/CNRS (France), MPG (Germany) and IGN (Spain).
© ESO 2022
1. Introduction
Abell 1367 (A1367) is a nearby (z = 0.022, D = 96 Mpc) dynamically unrelaxed cluster in the Coma supercluster with R500 = 924 kpc and at least two subclusters merging along the southeast-northwest direction (Ge et al. 2019). The cluster’s total mass is ∼3.3 × 10¹⁴ M⊙ (Boselli & Gavazzi 2006), which is about one-third of that of the Coma cluster. There are several ram pressure stripped (RPS) galaxies with offset HI distributions and multiphase tails and a prominent infalling group with an associated X-ray and Hα trail caused by ram pressure stripping (e.g., Gavazzi et al. 2001, 2003; Iglesias-Páramo et al. 2002; Scott et al. 2010, 2018; Yagi et al. 2017; Fossati et al. 2019). Recently, an isolated cloud at about 800 kpc in projection from the center of the cluster, not far from the major axis of the cluster, was discovered in narrow-band Hα imaging (Yagi et al. 2017). Due to the absence of an obvious parent galaxy within an 80 kpc search radius, the object was suggested as an orphan cloud (OC). It is projected at the base of a filament of galaxies which extends to the Coma cluster. It is also close to the cluster merger shock. Follow-up XMM observations in the field (Ge et al. 2019) revealed diffuse soft X-ray emission around the same position as the Hα OC. The X-ray OC is asymmetric around its X-ray peak, and a radial surface brightness profile centered on its peak shows an effective radius of ∼30 kpc. VLT/MUSE IFU observations (Ge et al. 2021) reveal that the Hα OC is elongated (∼10 kpc × 20 kpc) with a set of narrow filaments connected to the main body. There is a velocity gradient of ∼200 km s−1 in nearly the east-west direction.
It is likely that the origin of the OC is ISM stripped from an infalling galaxy. Whether it was due to ram pressure stripping, a tidal interaction, or a combination of both, is not clear. Assuming that the speed of the OC to the parent galaxy is less than ∼1000 km s−1 (cf. the A1367 radial velocity dispersion of 726 km s−1), the OC should have survived in the cluster environment for > 70 Myr. The MUSE observations and line diagnostics suggest high, about solar metallicity of the warm ionized gas (Ge et al. 2021), implying a massive parent for the OC. The temperature of the X-ray OC, 1.6 ± 0.1 keV, is higher than typical temperatures of X-ray RPS tails of cluster late-type galaxies (∼0.9 keV, Sun et al. 2010), which, together with the large distance to any possible parent galaxy, suggests an advanced evolutionary stage of the OC as it mixes with the surrounding ICM. The bright Hα part of the cloud may be associated with the only surviving cold clouds, while the bulk of the X-ray OC is free of cold gas now. The A1367 OC presents a unique laboratory to study the evolution of the ISM far away from the parent galaxy.
Here we present the first CO observations of the Hα-bright part of the OC. These observations show that the OC also contains a cold molecular gas component, in addition to the warm and hot ionized gas phases. Despite the presence of the molecular gas, only a very small amount of star formation was found in the OC (Ge et al. 2021), indicating that the conversion of the molecular gas to stars is extremely inefficient. The A1367 OC with its multiphase components of cold, warm, and hot gas is unique. In the Virgo cluster, several isolated HI clouds with no optical counterparts are known (Davies et al. 2004; Kent et al. 2007), as well as the low-mass, star-forming Hα cloud SECCO 1 (Beccari et al. 2017). There are also examples of isolated HI clouds in galaxy groups (e.g., Wong et al. 2021).
2. Observations
The observations were carried out with the IRAM 30-m telescope operated by the Institut de Radio Astronomie Millimétrique (IRAM) at Pico Veleta, Spain, from 01 June 2021 to 07 June 2021 (PI Jáchym, project ID 077-21). The EMIR receiver in the E090 and E230 bands was used to observe at the frequencies of the 12CO(1-0) (νrest = 115.271 GHz) and the 12CO(2-1) (νrest = 230.538 GHz) lines simultaneously. The FTS spectrometer, together with the WILMA autocorrelator, were connected to both receivers. Symmetric wobbler switching with the maximum secondary reflector throw of ±60″ and tphase = 1.5 Hz was used. Observing conditions varied from excellent with PWV as low as 1 − 2 mm to bad with PWV > 10 mm. Two nights (04 and 05 June) were lost due to unstable conditions and high wind.
Two regions of the OC were observed, one (“southern”, J2000 RA 11:44:22.89, Dec +20:10:31.5) covering the main peak of the Hα and the other (“northern”, J2000 RA 11:44:23.17, Dec +20:11:07.6) covering the neighboring peak of the X-ray emission (see Fig. 1, middle panel). The latter region lacks bright Hα features. These were deep observations, with on-source time for the southern and northern regions of 4.85 h and 3.8 h, respectively. In addition, we targeted the nearby galaxy 2MASX J11443212+2006238 with a pointed observation of 0.8 h. The half power beamwidth (HPBW) of the IRAM 30m main beam is ∼21.7″ and 10.9″ at the CO(1-0) and CO(2-1) frequencies, respectively. The data were reduced using CLASS from the GILDAS1 software package developed at IRAM. The corrected antenna temperatures,  , provided by the IRAM 30m calibration pipeline were converted to a main-beam brightness temperature by
  , using a main beam efficiency of ηmb = 0.78 at 115 GHz and 0.59 at 230 GHz, and the forward efficiencies Feff of 0.94 and 0.92, respectively. The flux density-to-main beam antenna temperature conversion factor is ∼5 Jy beam−1 K−1 for both bands (see Jáchym et al. 2017).
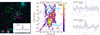 |
Fig. 1. Multiwavelength observations of the A1367 OC. Left: A1367 OC – the green contour outlines its X-ray morphology (0.5 − 2 keV XMM observations) overlaid on a Subaru three-color composite image (red, Hα; green, r-band; and blue, g-band). The dashed magenta region shows the MUSE FOV, and the blue circles indicate the IRAM CO(1-0) beams. Image adapted from Ge et al. (2021). The galaxy 2MASX J11443212+2006238 with its 85 kpc long Hα ram pressure stripped tail is visible to the south of the OC. The CO spectra from a pointing centered on this galaxy are shown in the inset. Middle: MUSE Hα image of the OC (Ge et al. 2021) showing the positions of the CO(1-0) and CO(2-1) beams (blue circles, HPBW of 21.7″ ≈ 9.7 kpc and 10.9″ ≈ 4.9 kpc, respectively). The black dashed contours show the peak X-ray emission of the OC. Right: CO(1-0) lines detected at the positions over the northern X-ray peak (top panel) and the southern Hα peak (bottom panel). Velocity corresponds to υrad = cz/(z + 1). The corresponding CO(2-1) spectra divided by a factor of 3 are shown with dotted blue lines. In the southern region (bottom panel), a marginal CO(2-1) line detection is suggested from a positive signal at velocities around the CO(1-0) line central velocity. |
3. Results
We detected CO(1-0) emission in both the southern and northern regions. Their CO(1-0) spectra, smoothed to 52 km s−1 resolution, are shown in the right panels of Fig. 1. Low rms values of about 0.31 mK and 0.46 mK, respectively, were achieved. In the southern region covering the Hα peak, the CO(1-0) line is detected with an S/N = Tpeak/σrms ∼ 4.4, and an integrated S/N = ICO/σint ∼ 8.7, where  corresponds to the noise over the spectral channels (of width Δυch) covered by the line. In Fig. 1 (right panel), the CO(1-0) spectral line is fitted with a Gaussian profile with a central velocity of ∼7096 km s−1 and a FWHM of 178 km s−1 (see also Table 1). The integrated intensity is ICO = 0.26 ± 0.04 K km s−1, which corresponds to a mean molecular gas column density of ∼1.2 M⊙ pc−2 and a molecular gas mass of ∼1.4 × 10⁸ M⊙, following the standard relation of Solomon & Vanden Bout (2005), and assuming a Galactic CO-to-H2 conversion factor of 2 × 1020 cm−2(K km s−1)−1.
Properties of the CO detections in the OC and the RPS galaxy 2MASX J11443212+2006238.
Quite unexpectedly, CO(1-0) was also detected in the northern region pointed over the neighboring X-ray peak, which is mostly devoid of Hα emission. It is a weaker detection than in the south with an S/N ∼ 3.4 and an integrated S/N ∼ 4.6 (see Fig. 1, right, top panel). The line is centered at a velocity about 50 km s−1 larger than the southern line, and its FWHM is smaller by a factor of two. The parameters of a Gaussian fit are given in Table 1. The corresponding mean H2 column density and H2 mass are ∼0.6 M⊙ pc−2 and ∼0.8 × 10⁸ M⊙, respectively.
There is no significant line detection in CO(2-1) in either region, although a weak signal at velocities around the CO(1-0) line suggests a marginal detection in the southern region (dashed-line spectra in Fig. 1, right panels). The rms sensitivity of the CO(2-1) spectrum per 52 km s−1 channel is 0.86 mK and 1.1 mK in the southern and northern regions, respectively. Using the widths of the CO(1-0) line, we can estimate the 3σ upper limit of the CO(2-1) luminosity. The corresponding upper limit on the  line ratio in the southern region is ∼0.22. When the size of the CO(1-0) beam is accounted for, which is four-times larger than the CO(2-1) beam, this value may be consistent with typical values of ∼0.8 in normal star-forming galaxies (Saintonge et al. 2017; Leroy et al. 2009). The lower value could also indicate that the molecular gas is diffuse, warmer, and weak in CO emission, due to heating by the neighboring hot gas components (Peñaloza et al. 2017). In the northern region, most of the CO emission is probably not coming from the center of the beam, but is more widespread within the CO(1-0) beam.
A Gaussian fit to the southern CO(1-0) line leads to a velocity dispersion of ∼74 km s−1. Such a high value points to multiple molecular clouds with typical velocity dispersion less than a few km s−1, but it may also be due to a velocity gradient in the beam. The CO velocity dispersion mirrors that of the median value of ∼60 km s−1 of the Hα emission. The velocity dispersion of the northern CO(1-0) emission is ∼37 km s−1, which may suggest that fewer molecular clouds were covered by the beam. The mean Hα velocity dispersion in the northern region is ∼52 km s−1. Higher resolution CO observations, resolving the emission in these areas, will be required to reveal the detailed morphology and kinematics of CO associated with the OC.
4. Discussion
4.1. Correlation of gas phases
The detected CO emission has velocities redshifted relative to the Hα component. Moreover, in the northern region, the CO emission is shifted to higher velocities relative to the southern region, while the underlying Hα emission in the two regions shows the opposite behavior.
The brightest Hα regions from MUSE (Ge et al. 2021) covered by the southern CO(1-0) beam have a median velocity of cz ∼ 7223 km s−1, while the central velocity of the CO(1-0) line is redshifted by ∼45 km s−1. The relatively large width of the CO line encompasses the Hα velocities. In the northern region, the only Hα emission is from the filaments at the edges of the CO(1-0) beam, with median velocities cz ∼ 7118 − 7230 km s−1 (with a representative value of cz ∼ 7182 km s−1), thus mostly blueshifted relative to the southern region. However, the northern CO line peaks ∼133 km s−1 higher and is thus rather strongly redshifted, both relative to the northern Hα emission as well as the southern CO line.
The velocity difference indicates that in the northern region, the cold and warm components are kinematically separated. In the southern region, the CO emission is more kinematically linked to the Hα emission, possibly due to a richer distribution of gas that covers a wider range in velocities.
The correlation of cold molecular and warm ionized phases is further explored in Fig. 2, where the two regions are plotted on the CO–Hα correlation suggested from previous observations of RPS tails (Jáchym et al. 2017). In the southern OC region, the integrated CO intensity and the Hα surface brightness enclosed within the IRAM beam are consistent with the correlation. The northern region is slightly offset – it has a factor of ∼2 lower Hα surface brightness for its CO integrated flux density. The plot in Fig. 2 comprises tail regions with a predominantly diffuse warm ionized gas component and no or only a few compact HII regions (the highest contribution of HII regions is in the inner part of the tail of the Norma galaxy ESO 137-001 – point 001A in the plot, where it makes up about 37% of the Hα flux). The correlation was measured at spatial scales of ∼5 − 10 kpc.
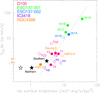 |
Fig. 2. CO integrated flux vs. Hα surface brightness measured in a sample of ram pressure stripped gas tails (Jáchym et al. 2017, their Fig. 9). The location of the two OC regions is shown with filled stars. The open star symbol corresponds to the northern region surface brightness, when the full area of the CO(1-0) beam is used instead of the actual Hα-emitting area within the beam (filled star). |
In addition, Ge et al. (2021) examined the correlation between the warm and hot ionized phases in the OC and compared it with the tight Hα–X-ray correlation recently found for RPS tails (Sun et al. 2021). They found excellent agreement for the southern region, while the X-ray/Hα ratio in the region encompassing our northern region is higher by a factor of ∼4 (Ge et al. 2021, see their Fig. 8).
Thus, the conditions in the southern region covering the main Hα cloud seem to be close to the stripped gas in typical RPS tails, where tight Hα–CO and Hα–X-ray correlations are observed. In the northern region, on the other hand, the gas may be locally in a different evolutionary phase with the elevated X-ray/Hα and CO/Hα ratios. In the north, the gas phases are physically separated: the peak of X-ray emission is surrounded by the colder Hα emission filaments, from which the CO emission is kinematically offset. It may be expected that the cold gas is also spatially offset from the hot gas, given the surprising fact that there is a cold gas associated with the location of the X-ray peak.
Spatial and kinematic offsets are characteristic for RPS tails, where different gas components may be both spatially and kinematically offset due to the effects of differential acceleration by ram pressure. For example, offsets of the CO, Hα, and X-ray emission were observed in the tail of the Norma cluster galaxy ESO 137-001 (Jáchym et al. 2019). In the Coma cluster galaxy D100, a kinematical offset of ∼50 km s−1 was measured along the tail between the Hα- and CO-emitting components (Jáchym et al. 2017). Future detailed CO mapping will show whether cold and warm gas velocity gradients occur along a consistent direction, and how the X-ray–Hα offset relates to it.
4.2. Mass budget
Following the estimates of Ge et al. (2021), the mass budget of the part of the OC covered by the MUSE observations is as follows: there is about 8 × 10⁷ M⊙ of warm Hα gas and about 3 × 10⁹ M⊙ of hot X-ray gas (which is about a third of the total OC X-ray emission). With the ∼2.2 × 10⁸ M⊙ of molecular gas detected in the two regions, our observations indicate that a molecular component may form about 10% of the total mass of the cloud, and that there is more cold than warm gas. From VLA observations (Scott et al. 2018), an upper limit on HI content in the area covering the cloud can be calculated (from their field D observed in the velocity range of 7091 − 7463 km s−1). For the OC region in the primary beam-corrected cube smoothed spatially to 45″, which is close to the size of the OC, the measured rms is ∼0.67 mJy in 11 km s−1 channels. Assuming the linewidths of the CO lines of 90 and 180 km s−1, the corresponding HI upper limits (corresponding to a 3σ-significance across three channels) are ∼2.2 × 10⁸ M⊙ and ∼3.1 × 10⁸ M⊙, respectively, thus similar to the lower limit on the molecular gas content.
4.3. Inefficient star formation
Analyses by Yagi et al. (2017) and Ge et al. (2021) indicated that star formation is almost absent in the OC. The upper limit for the star formation rate (SFR) of 6 × 10⁻⁴ M⊙ yr−1 was estimated from the lack of any GALEX sources in the MUSE field, with the calibration from Kennicutt & Evans (2012). The only HII candidate in the MUSE field was identified outside the main Hα cloud at RA 11:44:21.4, Dec +20:10:14.6 (see Fig. 3 in Ge et al. 2021).
For the typical molecular gas depletion time in nearby spiral galaxies τdep, H2 ≈ 2 Gyr (e.g., Bigiel et al. 2011; Leroy et al. 2013), the molecular gas mass of 2.2 × 10⁸ M⊙ would correspond to a SFR = MH2/τdep, H2 ∼ 0.1 M⊙ yr−1. The observed upper limit on the SFR is thus more than two orders of magnitude lower, indicating that the process of converting molecular gas into stars in the OC is extremely inefficient2. The inefficiency further increases when the atomic HI content’s upper limit is taken into account.
The detected molecular gas is in a non-star-forming state. The physical conditions in the OC are likely distinct from galactic disks where star formation typically occurs. Some factors which, under typical conditions, drive and regulate star formation might be absent in the OC (e.g., the gravitational potential of a galaxy disk, stellar feedback, and UV background radiation), while some others are likely present (e.g., heat conduction or shocks from the surrounding ICM). This is similar to the conditions in RPS tails, where star formation can occur when it is still close to the galaxy, or just recently stripped, but it becomes less likely with increasing time and distance.
The CO velocity dispersion in the OC is rather high and similar to the velocity dispersion in the warm gas, which makes the gas less likely to be self-gravitating. While a highly resolved observations of the velocity field would be needed, shocks induced by ram pressure may increase the turbulent kinetic energy which stabilize molecular clouds, increasing their virial parameter and preventing them from collapse (e.g., Sivanandam et al. 2010).
The density of the molecular gas may play an important role in the low star-formation efficiency. The low mean surface density of ∼1 M⊙ pc−2 corresponding to the measured integrated CO intensity suggests that the volume density of the molecular gas is very low, or that the fraction of the dense molecular phase that is more tightly correlated with star formation (e.g., Gao & Solomon 2004) in the OC is limited. Recent observations of RPS tails indicated that an important fraction of the molecular component is extended, and its fraction increases with the distance from the parent galaxy (Jáchym et al. 2019; Moretti et al. 2020).
For comparison, the known examples of jellyfish tails with a detected molecular component revealed molecular gas depletion times > 1010 yr (Jáchym et al. 2014, 2017; Moretti et al. 2018, 2020). Their star formation rates vary in the range of ∼0.01 − 1 M⊙ yr−1 (e.g., Poggianti et al. 2019; Cramer et al. 2019; Kenney et al. 2014). One of the extreme cases is the tail of the Coma cluster RPS galaxy D100, where for the detected MH2 ∼ 109 M⊙, the SFR is only ∼6.0 × 10⁻³ M⊙ yr−1, and thus τdep, H2 ∼ 1.6 × 10¹¹ yr. Long depletion times were previously observed locally in some tidally disturbed galaxies (e.g., Tomičić et al. 2018), gas disks in early-type galaxies that are more stable against fragmentation to dense clumps due to the lower disk self-gravity and increased shear (e.g., Martig et al. 2013), HI-excess galaxies in low-density environments (Geréb et al. 2018), or outer parts of spiral disks which, however, are dominated by a (low column density) HI component (Bigiel et al. 2010; Yıldız et al. 2017).
4.4. Origin of the molecular OC
Given the large projected distance of > 80 kpc of the OC from any possible parent galaxy, it is reasonable to suggest that the OC is in an advanced evolutionary state and that the original cold gas was heated due to mixing with the hot ICM. In RPS tails, compact molecular gas detected at large (several tens of kiloparsecs) distances from the main galaxies are expected to have formed in situ from the stripped gas (Jáchym et al. 2019; Moretti et al. 2020).
Dust survival is an essential element of the formation of molecular gas (e.g., Hollenbach & McKee 1979). This implies that in the OC, the stripped gas that has mixed with the ICM wind still keeps a fraction of its initial dust content. Recent 3D hydrodynamic simulations of the evolution of cold (103 K) dusty clouds in a hot wind indicate that if the characteristic cooling timescales of the mixed gas are shorter than the cloud crushing time, the atomic phase can survive, and once the cloud is entrained by the wind, it will cool down and molecular gas may reform (Farber & Gronke 2022; Gronke & Oh 2020; Kanjilal et al. 2021). Another factor that could help the recent formation of molecular gas is compression due to ram pressure. The Hα OC has a velocity gradient nearly aligned in the east-west direction (Ge et al. 2021), which, together with the elevated values of the Hα velocity dispersion at the west side of the OC, may suggest that the west edge experiences an ICM ram pressure.
4.5. Molecular content of a nearby RPS galaxy
About 100 kpc southward of the OC at the same redshift lies the galaxy 2MASX J11443212+2006238, which has an 85 kpc long Hα ram pressure stripped tail (Gavazzi et al. 2017, see Fig. 1, left panel). Both CO(1-0) and CO(2-1) emission was strongly detected in the main body of the galaxy (see the inset spectra in Fig. 1, left panel), with a corresponding H2 mass of ∼2.4 × 10⁹ M⊙. Table 1 summarizes the rms sensitivity of the CO data in 20 km s−1 channels and the parameters of the Gaussian fits. The fits indicate that the line profiles are slightly asymmetric, especially in CO(1-0), likely corresponding to the redistribution of the molecular gas due to ram pressure stripping. The CO emission shows no offset in radial velocity from Hα (Gavazzi et al. 2017).
2MASX J11443212+2006238 illustrates an early phase of ram pressure stripping when the tail is connected to a star-forming, Hα-bright disk (Yagi et al. 2017). This is in obvious contrast to the late evolutionary phase of the neighboring OC which has detached from its parent galaxy and has evolved and mixed with the hot ICM.
Despite the similar velocities and the projected proximity, there is no direct observational evidence that the galaxy is related to the OC; also, 2MASX could not be the RPS parent of the OC either since its radial velocity would likely need to be substantially larger (redshifted) than that of the OC. While the origin of the OC will be studied elsewhere, we note that there are several galaxy pairs with a known HI-deficient late-type galaxy member near the OC (Scott et al. 2010, 2018). A pair tidal interaction loosening the ISM from the pair’s gravitational potential with subsequent RPS could also be a viable scenario for the origin of the gas in the OC.
5. Conclusions
Using the IRAM 30m telescope, we have detected CO(1-0) emission in two regions of the multiphase OC. This recently discovered object lies at ∼800 kpc north of the center of the Abell 1367 galaxy cluster. About 1.4 × 10⁸ M⊙ of H2 was detected in the region covering the peak in Hα emission (assuming a standard Galactic CO-to-H2 conversion factor) and about 8 × 10⁷ M⊙ in the region separated by ∼12 kpc, where X-ray emission has a peak, surrounded by Hα filaments, as shown by the MUSE observations (see Fig. 1; Ge et al. 2021).
In the region covering the Hα peak, the conditions seem to be consistent with that of gas in typical ram pressure stripped tails and follows the established tight Hα–X-ray and Hα–CO correlations. In the region covering the X-ray peak, the X-ray/Hα and CO/Hα ratios are elevated by factors of 4 and 2, respectively, and the mean velocity of the CO emission is offset from the warm ionized component by more than 100 km s−1. This may support the scenario of the RPS origin of the OC since spatial and kinematics offsets of gas phases (as well as the presence of a velocity gradient) are characteristic of RPS tails.
The CO velocity dispersion in the two regions is rather high (∼70 & 40 km s−1). Together with the presumably low molecular gas volume density, this may be the principal factor in the extremely low star formation efficiency of the detected molecular gas (τdep, H2 ∼ 3.7 × 10¹¹ yr).
The OC likely represents a late evolutionary product of a gas stripping event of an unidentified cluster galaxy. Its total mass is dominated by the hot ionized component, while the molecular gas forms about 10% of the total mass budget, similar to the upper limit contribution by HI emission calculated from existing VLA observations.
In contrast to the aged OC, we also observed the nearby galaxy 2MASX J11443212+2006238, which is in an early stage of ram pressure stripping, and detected ∼2.4 × 10⁹ M⊙ of molecular gas in its main body.
We note that uncertainty in the CO-to-H2 conversion factor cannot account for such a low efficiency and extremely long depletion times.
Acknowledgments
We warmly thank the IRAM 30-m observatory staff for their help during the observations and with the preparation of observing scripts. P. J. acknowledges support from the project LM2018106 of the Ministry of Education, Youth and Sports of the Czech Republic and from the project RVO:67985815. M.S. acknowledges support provided by the NASA grant 80NSSC19K0953 and the NSF grant 1714764. T. S. acknowledges support by Fundação para a Ciência e a Tecnologia (FCT) through national funds (UID/FIS/04434/2013), FCT/MCTES through national funds (PIDDAC) by this grant UID/FIS/04434/2019 and by FEDER through COMPETE2020 (POCI–01–0145–FEDER–007672). T. S. also acknowledges support from DL 57/2016/CP1364/CT0009.
References
- Beccari, G., Bellazzini, M., Magrini, L., et al. 2017, MNRAS, 465, 2189 [NASA ADS] [CrossRef] [Google Scholar]
- Bigiel, F., Leroy, A., Walter, F., et al. 2010, AJ, 140, 1194 [NASA ADS] [CrossRef] [Google Scholar]
- Bigiel, F., Leroy, A. K., Walter, F., et al. 2011, ApJ, 730, L13 [NASA ADS] [CrossRef] [Google Scholar]
- Boselli, A., & Gavazzi, G. 2006, PASP, 118, 517 [Google Scholar]
- Cramer, W. J., Kenney, J. D. P., Sun, M., et al. 2019, ApJ, 870, 63 [Google Scholar]
- Davies, J., Minchin, R., Sabatini, S., et al. 2004, MNRAS, 349, 922 [NASA ADS] [CrossRef] [Google Scholar]
- Farber, R. J., & Gronke, M. 2022, MNRAS, 510, 551 [Google Scholar]
- Fossati, M., Fumagalli, M., Gavazzi, G., et al. 2019, MNRAS, 484, 2212 [NASA ADS] [CrossRef] [Google Scholar]
- Gao, Y., & Solomon, P. M. 2004, ApJ, 606, 271 [NASA ADS] [CrossRef] [Google Scholar]
- Gavazzi, G., Boselli, A., Mayer, L., et al. 2001, ApJ, 563, L23 [Google Scholar]
- Gavazzi, G., Cortese, L., Boselli, A., et al. 2003, ApJ, 597, 210 [NASA ADS] [CrossRef] [Google Scholar]
- Gavazzi, G., Consolandi, G., Yagi, M., et al. 2017, A&A, 606, A131 [NASA ADS] [CrossRef] [EDP Sciences] [Google Scholar]
- Ge, C., Sun, M., Liu, R.-Y., et al. 2019, MNRAS, 486, L36 [NASA ADS] [CrossRef] [Google Scholar]
- Ge, C., Luo, R., Sun, M., et al. 2021, MNRAS, 505, 4702 [NASA ADS] [CrossRef] [Google Scholar]
- Geréb, K., Janowiecki, S., Catinella, B., et al. 2018, MNRAS, 476, 896 [Google Scholar]
- Gronke, M., & Oh, S. P. 2020, MNRAS, 492, 1970 [Google Scholar]
- Hollenbach, D., & McKee, C. F. 1979, ApJS, 41, 555 [Google Scholar]
- Iglesias-Páramo, J., Boselli, A., Cortese, L., et al. 2002, A&A, 384, 383 [NASA ADS] [CrossRef] [EDP Sciences] [Google Scholar]
- Jáchym, P., Combes, F., Cortese, L., et al. 2014, ApJ, 792, 11 [CrossRef] [Google Scholar]
- Jáchym, P., Sun, M., Kenney, J. D. P., et al. 2017, ApJ, 839, 114 [Google Scholar]
- Jáchym, P., Kenney, J. D. P., Sun, M., et al. 2019, ApJ, 883, 145 [Google Scholar]
- Kanjilal, V., Dutta, A., & Sharma, P. 2021, MNRAS, 501, 1143 [Google Scholar]
- Kenney, J. D. P., Geha, M., Jáchym, P., et al. 2014, ApJ, 780, 119 [Google Scholar]
- Kennicutt, R. C., & Evans, N. J. 2012, ARA&A, 50, 531 [NASA ADS] [CrossRef] [Google Scholar]
- Kent, B. R., Giovanelli, R., Haynes, M. P., et al. 2007, ApJ, 665, L15 [NASA ADS] [CrossRef] [Google Scholar]
- Leroy, A. K., Walter, F., Bigiel, F., et al. 2009, AJ, 137, 4670 [Google Scholar]
- Leroy, A. K., Walter, F., Sandstrom, K., et al. 2013, AJ, 146, 19 [Google Scholar]
- Martig, M., Crocker, A. F., Bournaud, F., et al. 2013, MNRAS, 432, 1914 [NASA ADS] [CrossRef] [Google Scholar]
- Moretti, A., Paladino, R., Poggianti, B. M., et al. 2018, MNRAS, 480, 2508 [Google Scholar]
- Moretti, A., Paladino, R., Poggianti, B. M., et al. 2020, ApJ, 889, 9 [Google Scholar]
- Peñaloza, C. H., Clark, P. C., Glover, S. C. O., et al. 2017, MNRAS, 465, 2277 [CrossRef] [Google Scholar]
- Poggianti, B. M., Gullieuszik, M., Tonnesen, S., et al. 2019, MNRAS, 482, 4466 [Google Scholar]
- Saintonge, A., Catinella, B., Tacconi, L. J., et al. 2017, ApJS, 233, 22 [Google Scholar]
- Scott, T. C., Bravo-Alfaro, H., Brinks, E., et al. 2010, MNRAS, 403, 1175 [Google Scholar]
- Scott, T. C., Brinks, E., Cortese, L., et al. 2018, MNRAS, 475, 4648 [NASA ADS] [CrossRef] [Google Scholar]
- Sivanandam, S., Rieke, M. J., & Rieke, G. H. 2010, ApJ, 717, 147 [NASA ADS] [CrossRef] [Google Scholar]
- Solomon, P. M., & Vanden Bout, P. A. 2005, ARA&A, 43, 677 [NASA ADS] [CrossRef] [Google Scholar]
- Sun, M., Donahue, M., Roediger, E., et al. 2010, ApJ, 708, 946 [Google Scholar]
- Sun, M., Ge, C., Luo, R., et al. 2021, Nat. Astron., in press [arXiv:2103.09205] [Google Scholar]
- Tomičić, N., Hughes, A., Kreckel, K., et al. 2018, ApJ, 869, L38 [CrossRef] [Google Scholar]
- Wong, O. I., Stevens, A. R. H., For, B.-Q., et al. 2021, MNRAS, 507, 2905 [NASA ADS] [CrossRef] [Google Scholar]
- Yagi, M., Yoshida, M., Gavazzi, G., et al. 2017, ApJ, 839, 65 [NASA ADS] [CrossRef] [Google Scholar]
- Yıldız, M. K., Serra, P., Peletier, R. F., et al. 2017, MNRAS, 464, 329 [CrossRef] [Google Scholar]
All Tables
Properties of the CO detections in the OC and the RPS galaxy 2MASX J11443212+2006238.
All Figures
|
Fig. 1. Multiwavelength observations of the A1367 OC. Left: A1367 OC – the green contour outlines its X-ray morphology (0.5 − 2 keV XMM observations) overlaid on a Subaru three-color composite image (red, Hα; green, r-band; and blue, g-band). The dashed magenta region shows the MUSE FOV, and the blue circles indicate the IRAM CO(1-0) beams. Image adapted from Ge et al. (2021). The galaxy 2MASX J11443212+2006238 with its 85 kpc long Hα ram pressure stripped tail is visible to the south of the OC. The CO spectra from a pointing centered on this galaxy are shown in the inset. Middle: MUSE Hα image of the OC (Ge et al. 2021) showing the positions of the CO(1-0) and CO(2-1) beams (blue circles, HPBW of 21.7″ ≈ 9.7 kpc and 10.9″ ≈ 4.9 kpc, respectively). The black dashed contours show the peak X-ray emission of the OC. Right: CO(1-0) lines detected at the positions over the northern X-ray peak (top panel) and the southern Hα peak (bottom panel). Velocity corresponds to υrad = cz/(z + 1). The corresponding CO(2-1) spectra divided by a factor of 3 are shown with dotted blue lines. In the southern region (bottom panel), a marginal CO(2-1) line detection is suggested from a positive signal at velocities around the CO(1-0) line central velocity. |
| In the text | |
|
Fig. 2. CO integrated flux vs. Hα surface brightness measured in a sample of ram pressure stripped gas tails (Jáchym et al. 2017, their Fig. 9). The location of the two OC regions is shown with filled stars. The open star symbol corresponds to the northern region surface brightness, when the full area of the CO(1-0) beam is used instead of the actual Hα-emitting area within the beam (filled star). |
| In the text | |
Current usage metrics show cumulative count of Article Views (full-text article views including HTML views, PDF and ePub downloads, according to the available data) and Abstracts Views on Vision4Press platform.
Data correspond to usage on the plateform after 2015. The current usage metrics is available 48-96 hours after online publication and is updated daily on week days.
Initial download of the metrics may take a while.