Fig. 1.
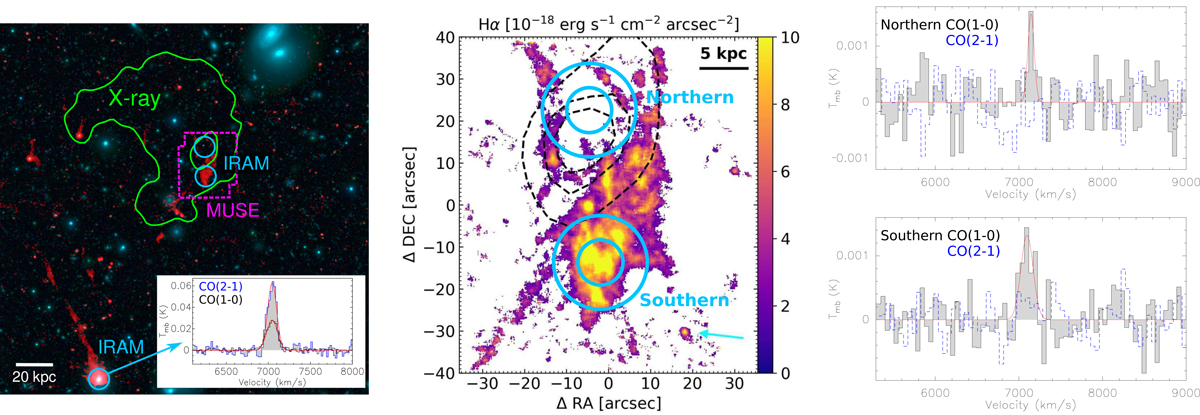
Download original image
Multiwavelength observations of the A1367 OC. Left: A1367 OC – the green contour outlines its X-ray morphology (0.5 − 2 keV XMM observations) overlaid on a Subaru three-color composite image (red, Hα; green, r-band; and blue, g-band). The dashed magenta region shows the MUSE FOV, and the blue circles indicate the IRAM CO(1-0) beams. Image adapted from Ge et al. (2021). The galaxy 2MASX J11443212+2006238 with its 85 kpc long Hα ram pressure stripped tail is visible to the south of the OC. The CO spectra from a pointing centered on this galaxy are shown in the inset. Middle: MUSE Hα image of the OC (Ge et al. 2021) showing the positions of the CO(1-0) and CO(2-1) beams (blue circles, HPBW of 21.7″ ≈ 9.7 kpc and 10.9″ ≈ 4.9 kpc, respectively). The black dashed contours show the peak X-ray emission of the OC. Right: CO(1-0) lines detected at the positions over the northern X-ray peak (top panel) and the southern Hα peak (bottom panel). Velocity corresponds to υrad = cz/(z + 1). The corresponding CO(2-1) spectra divided by a factor of 3 are shown with dotted blue lines. In the southern region (bottom panel), a marginal CO(2-1) line detection is suggested from a positive signal at velocities around the CO(1-0) line central velocity.
Current usage metrics show cumulative count of Article Views (full-text article views including HTML views, PDF and ePub downloads, according to the available data) and Abstracts Views on Vision4Press platform.
Data correspond to usage on the plateform after 2015. The current usage metrics is available 48-96 hours after online publication and is updated daily on week days.
Initial download of the metrics may take a while.