Open Access
Fig. 3.
Download original image
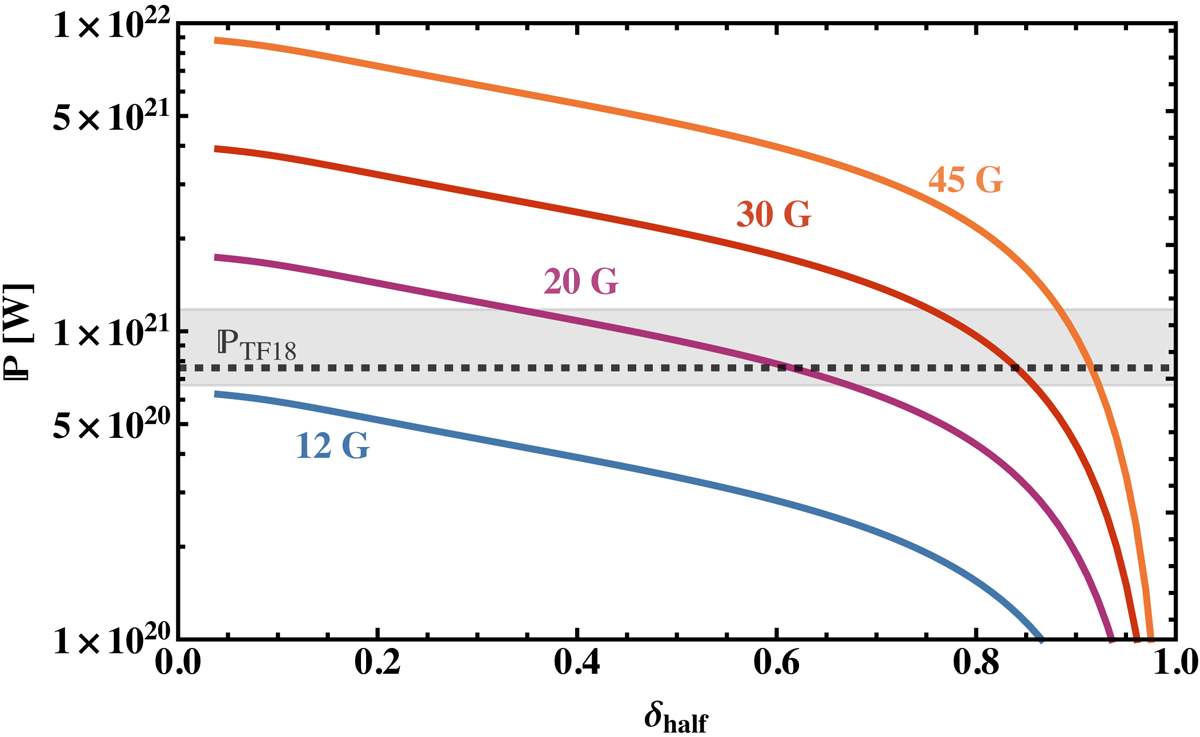
OD rate as a function of the wind profile δhalf for HD 209458 b with vmax = 2 km s−1 (Snellen et al. 2010). The colors represent different magnetic field strengths at the equator, and the gray region indicates the anomalous heating rate computed by Thorngren & Fortney (2018).
Current usage metrics show cumulative count of Article Views (full-text article views including HTML views, PDF and ePub downloads, according to the available data) and Abstracts Views on Vision4Press platform.
Data correspond to usage on the plateform after 2015. The current usage metrics is available 48-96 hours after online publication and is updated daily on week days.
Initial download of the metrics may take a while.