Free Access
Fig. 9.
Download original image
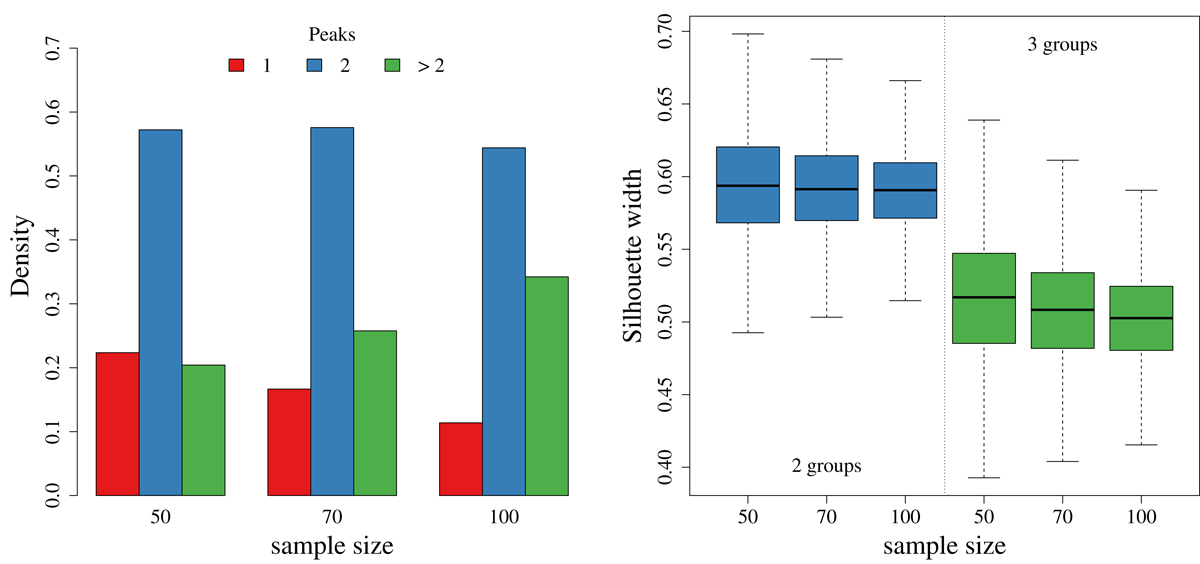
Left: empirical density function for the number of peaks detected in the MC simulation, classified according to the sample size (see text). Right: boxplots of the average silhouette widths for two- and three-group splits, according to the sample size.
Current usage metrics show cumulative count of Article Views (full-text article views including HTML views, PDF and ePub downloads, according to the available data) and Abstracts Views on Vision4Press platform.
Data correspond to usage on the plateform after 2015. The current usage metrics is available 48-96 hours after online publication and is updated daily on week days.
Initial download of the metrics may take a while.