Fig. 3.
Download original image
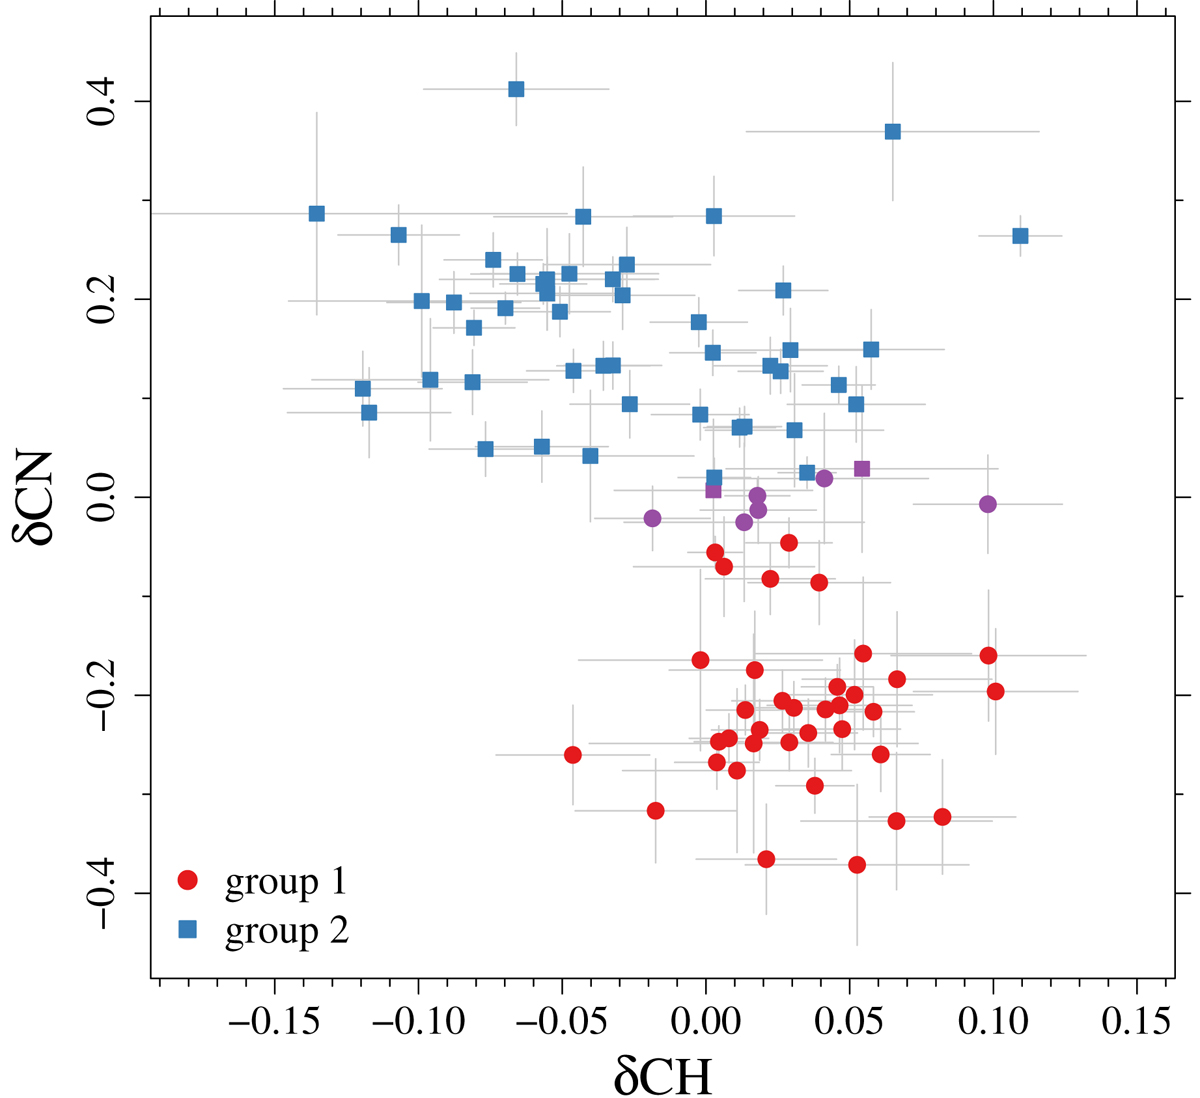
Scatter plot in the δCN vs. δCH plane for the low-resolution spectroscopy data set. Data are classified according to the MC resampling. Circles correspond to objects classified into group 1, and squares show objects classified into group 2. Colours were adopted to distinguish data according to the cluster membership probability. Purple symbols correspond to data for which the classification is uncertain (see text for details).
Current usage metrics show cumulative count of Article Views (full-text article views including HTML views, PDF and ePub downloads, according to the available data) and Abstracts Views on Vision4Press platform.
Data correspond to usage on the plateform after 2015. The current usage metrics is available 48-96 hours after online publication and is updated daily on week days.
Initial download of the metrics may take a while.