Fig. 1.
Download original image
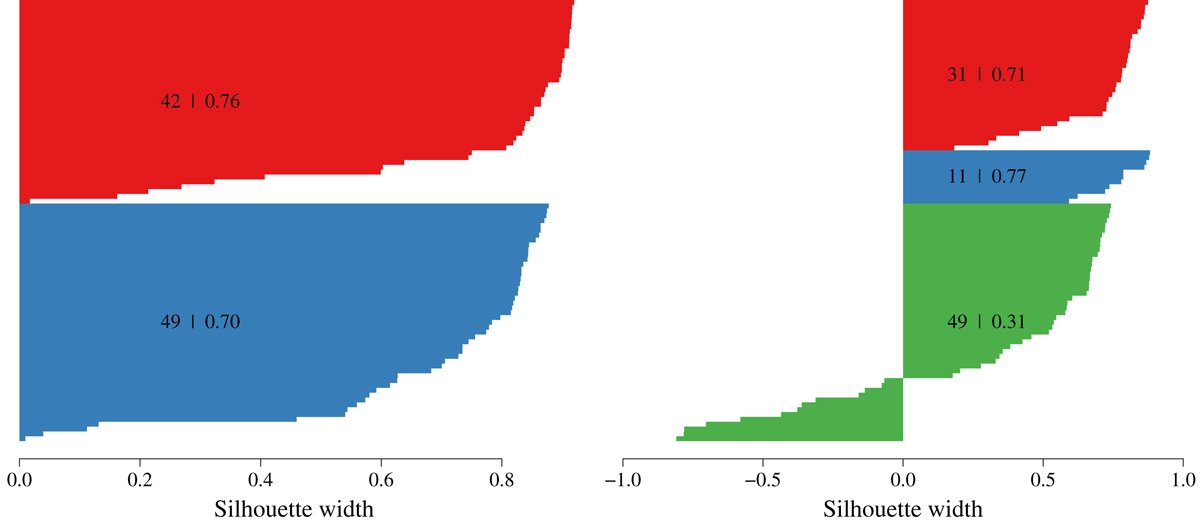
Left: silhouette plot of the divisive HC applied to the low-resolution spectroscopy data set for a two-group split. Right: same as in the left panel, but for a three-group split. The bars correspond to the silhouette values of objects clustered in the first group (red), in the second group (blue), and in the third group (green). The average silhouettes for the groups are listed along with the group sizes.
Current usage metrics show cumulative count of Article Views (full-text article views including HTML views, PDF and ePub downloads, according to the available data) and Abstracts Views on Vision4Press platform.
Data correspond to usage on the plateform after 2015. The current usage metrics is available 48-96 hours after online publication and is updated daily on week days.
Initial download of the metrics may take a while.