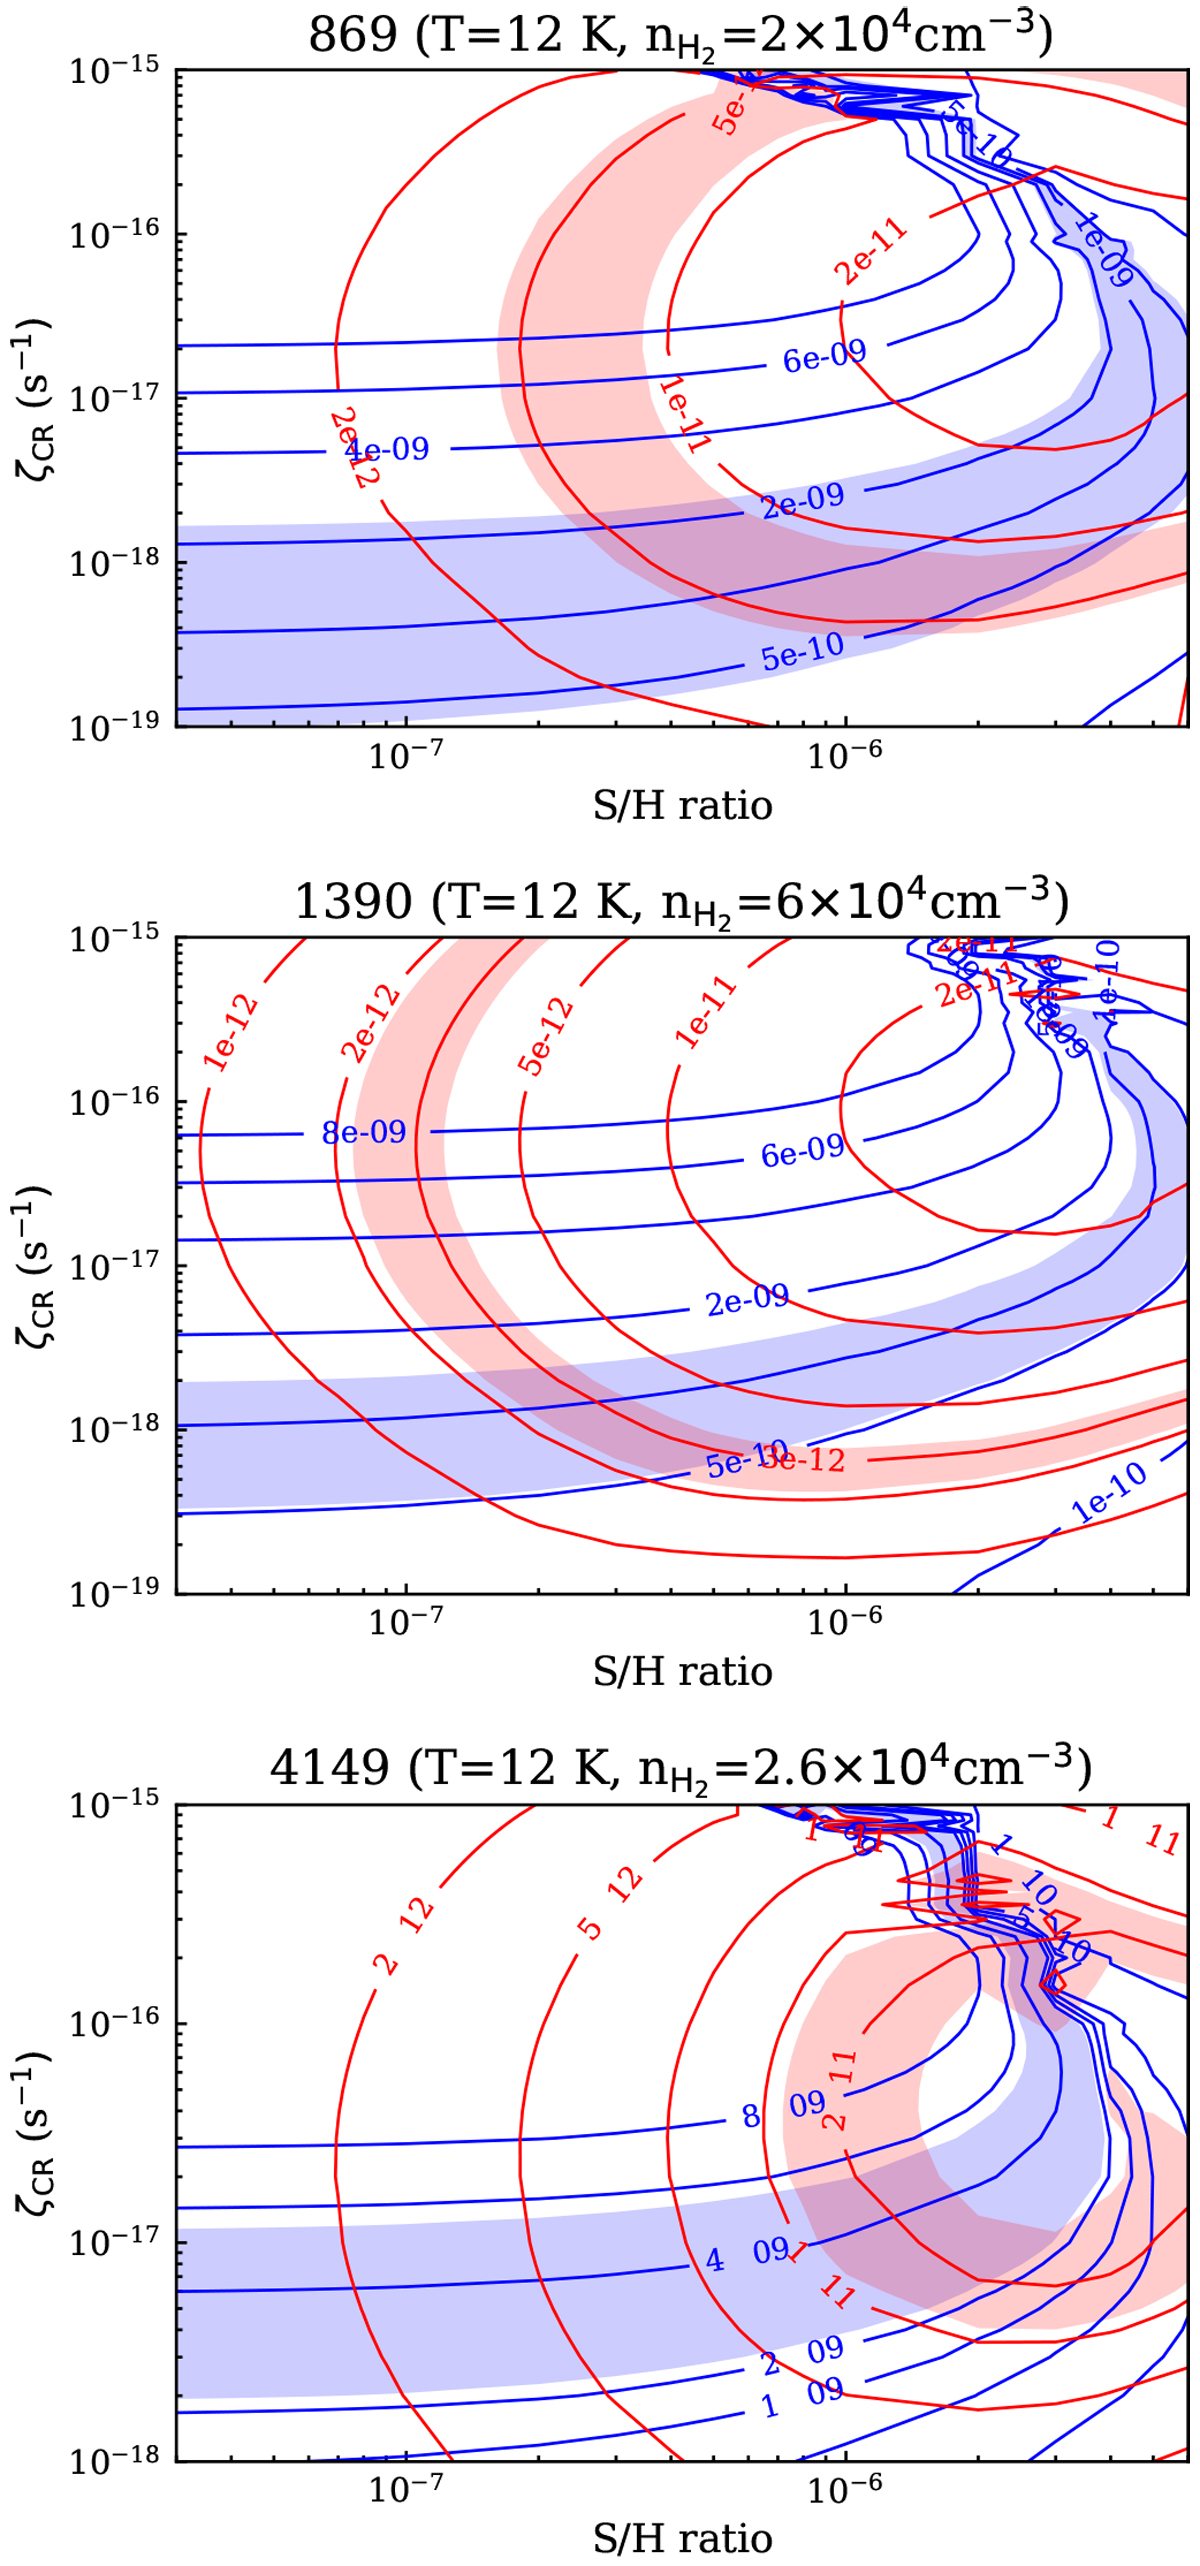
Fig. 9
Download original image
Contour plots of HCO+/H2 (blue line) and HCS+/H2 (red line) abundance ratios as a function of cosmic-ray ionisation rate and S/H gaseous elemental abundance. The blue and red zones mark the observational abundances. N(HCO+) = N(HC18O+) × 16O/18, where 16O/18O = 557. The models were obtained for a gas temperature of 12 K, an evolutionary time of 10 Myr, and an H2 density of 2 × 104 cm−3 (869), 6× 104 cm−3 (1390), and 2.6 × 104 cm−3 (4149).
Current usage metrics show cumulative count of Article Views (full-text article views including HTML views, PDF and ePub downloads, according to the available data) and Abstracts Views on Vision4Press platform.
Data correspond to usage on the plateform after 2015. The current usage metrics is available 48-96 hours after online publication and is updated daily on week days.
Initial download of the metrics may take a while.