Open Access
Fig. 5
Download original image
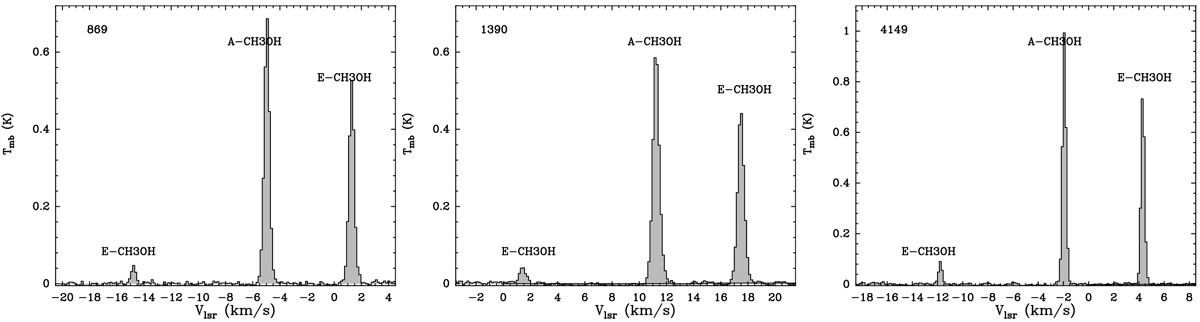
Observations of the 2k → 1k methanol triplet toward 869 (left), 1390 (middle), and 4149 (right). The rest frequency for these plots is defined as the strongest transition, the A+ line at 96.741 GHz. The E transition on the left side is 20–10 at 96.744 GHz, and the E transition on the right side is 2−1–1−1 at 96.739 GHz
Current usage metrics show cumulative count of Article Views (full-text article views including HTML views, PDF and ePub downloads, according to the available data) and Abstracts Views on Vision4Press platform.
Data correspond to usage on the plateform after 2015. The current usage metrics is available 48-96 hours after online publication and is updated daily on week days.
Initial download of the metrics may take a while.