Fig. 2
Download original image
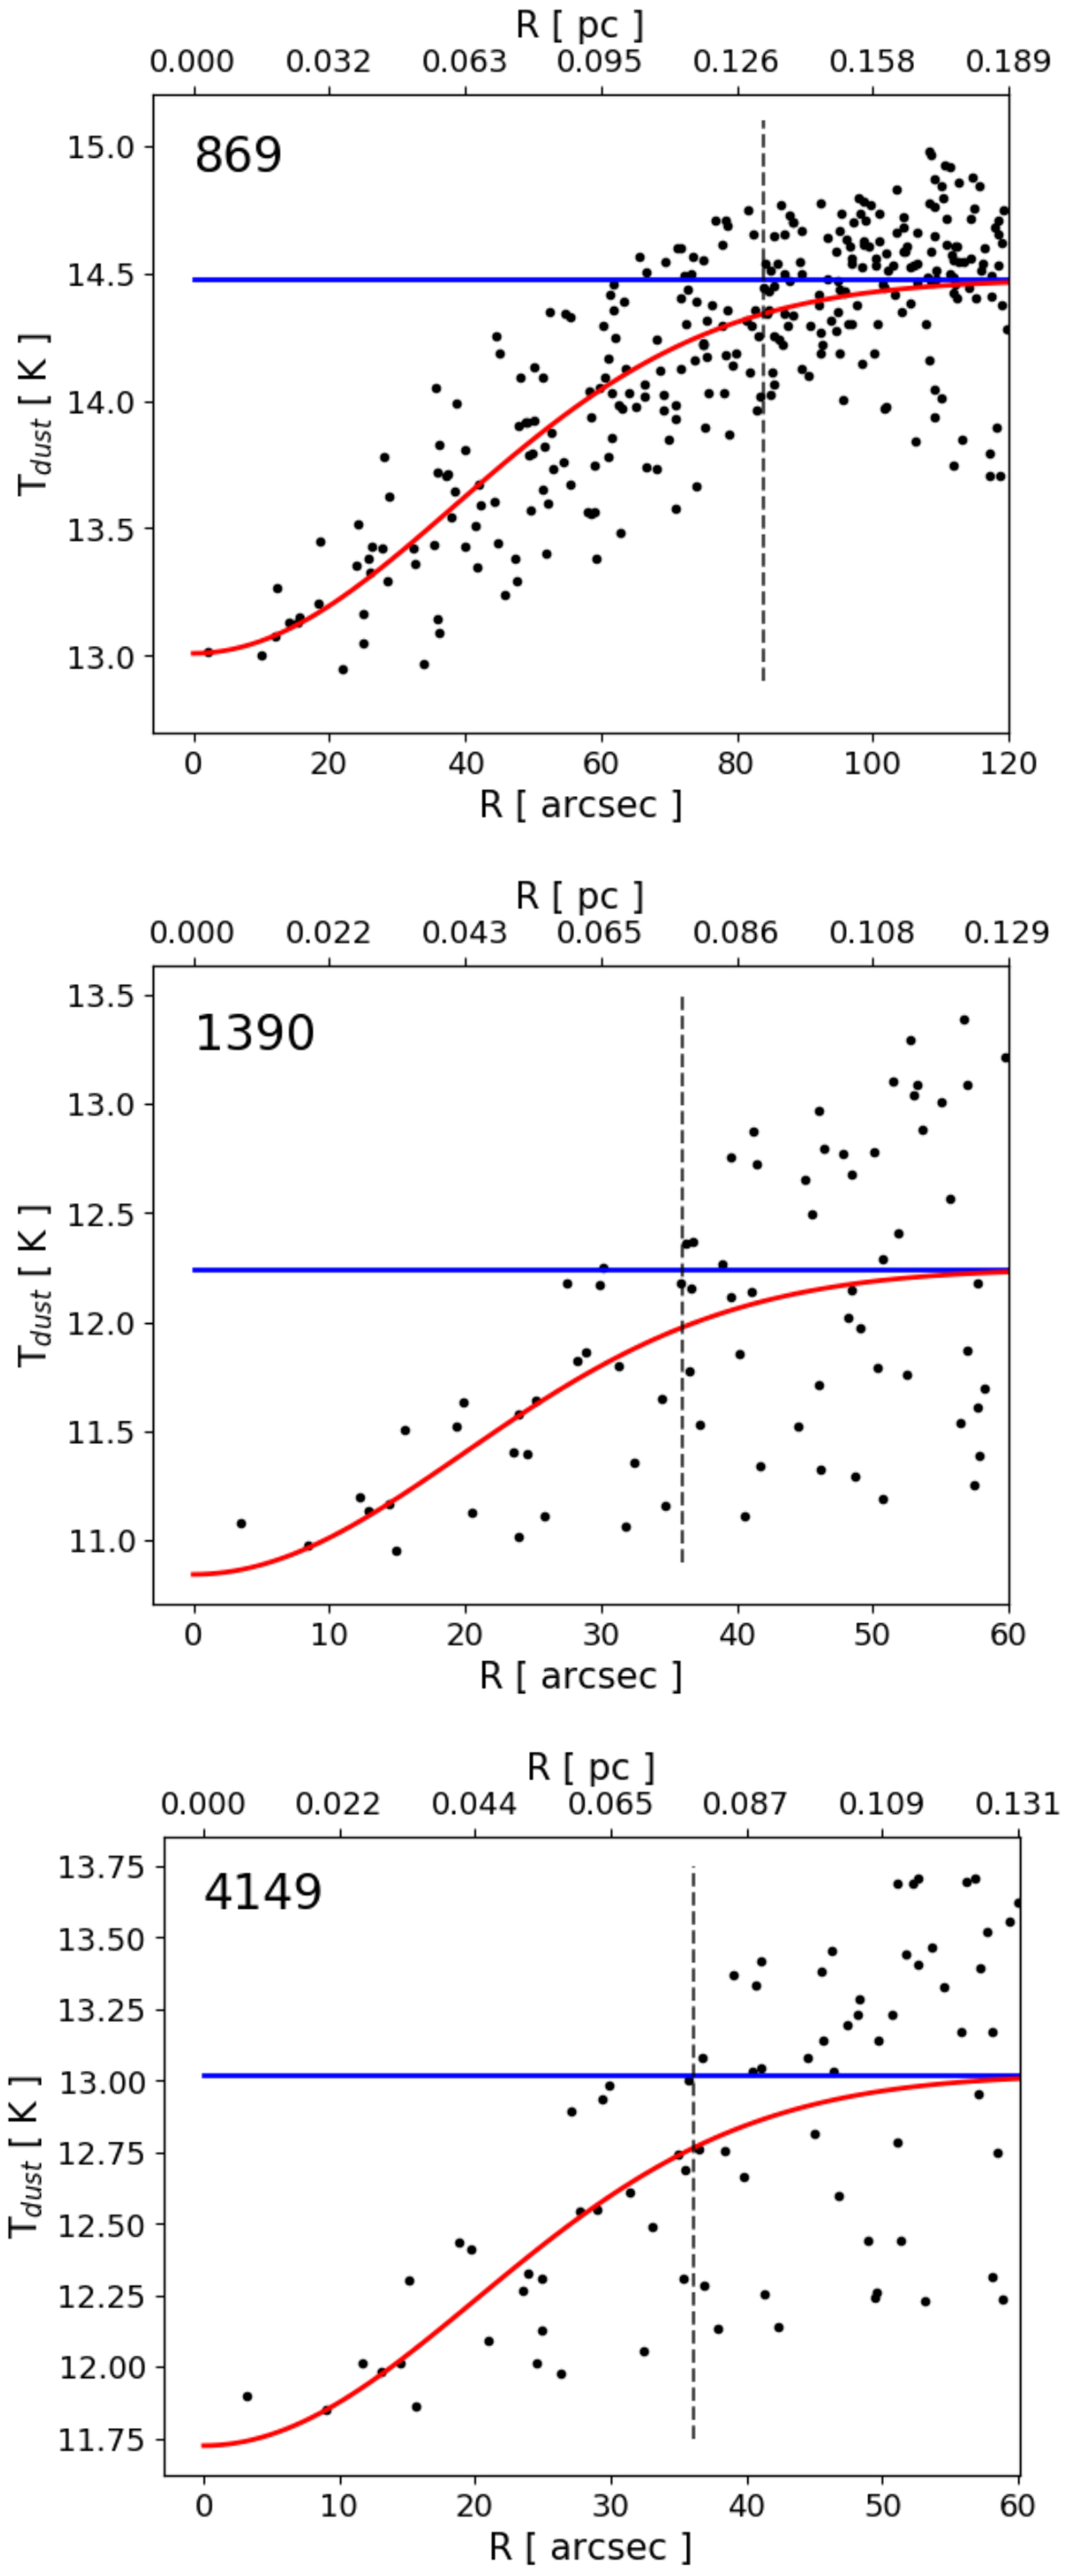
Dust temperature profiles of the three targeted sources (869, 1390, and 4149 from top to bottom). The black points are individual pixels in the dust temperature maps derived from Herschel data by Montillaud et al. (2015), the blue lines show the average dust temperature of the points beyond the vertical dashed line, and the red lines are Gaussian fits.
Current usage metrics show cumulative count of Article Views (full-text article views including HTML views, PDF and ePub downloads, according to the available data) and Abstracts Views on Vision4Press platform.
Data correspond to usage on the plateform after 2015. The current usage metrics is available 48-96 hours after online publication and is updated daily on week days.
Initial download of the metrics may take a while.