Fig. 11
Download original image
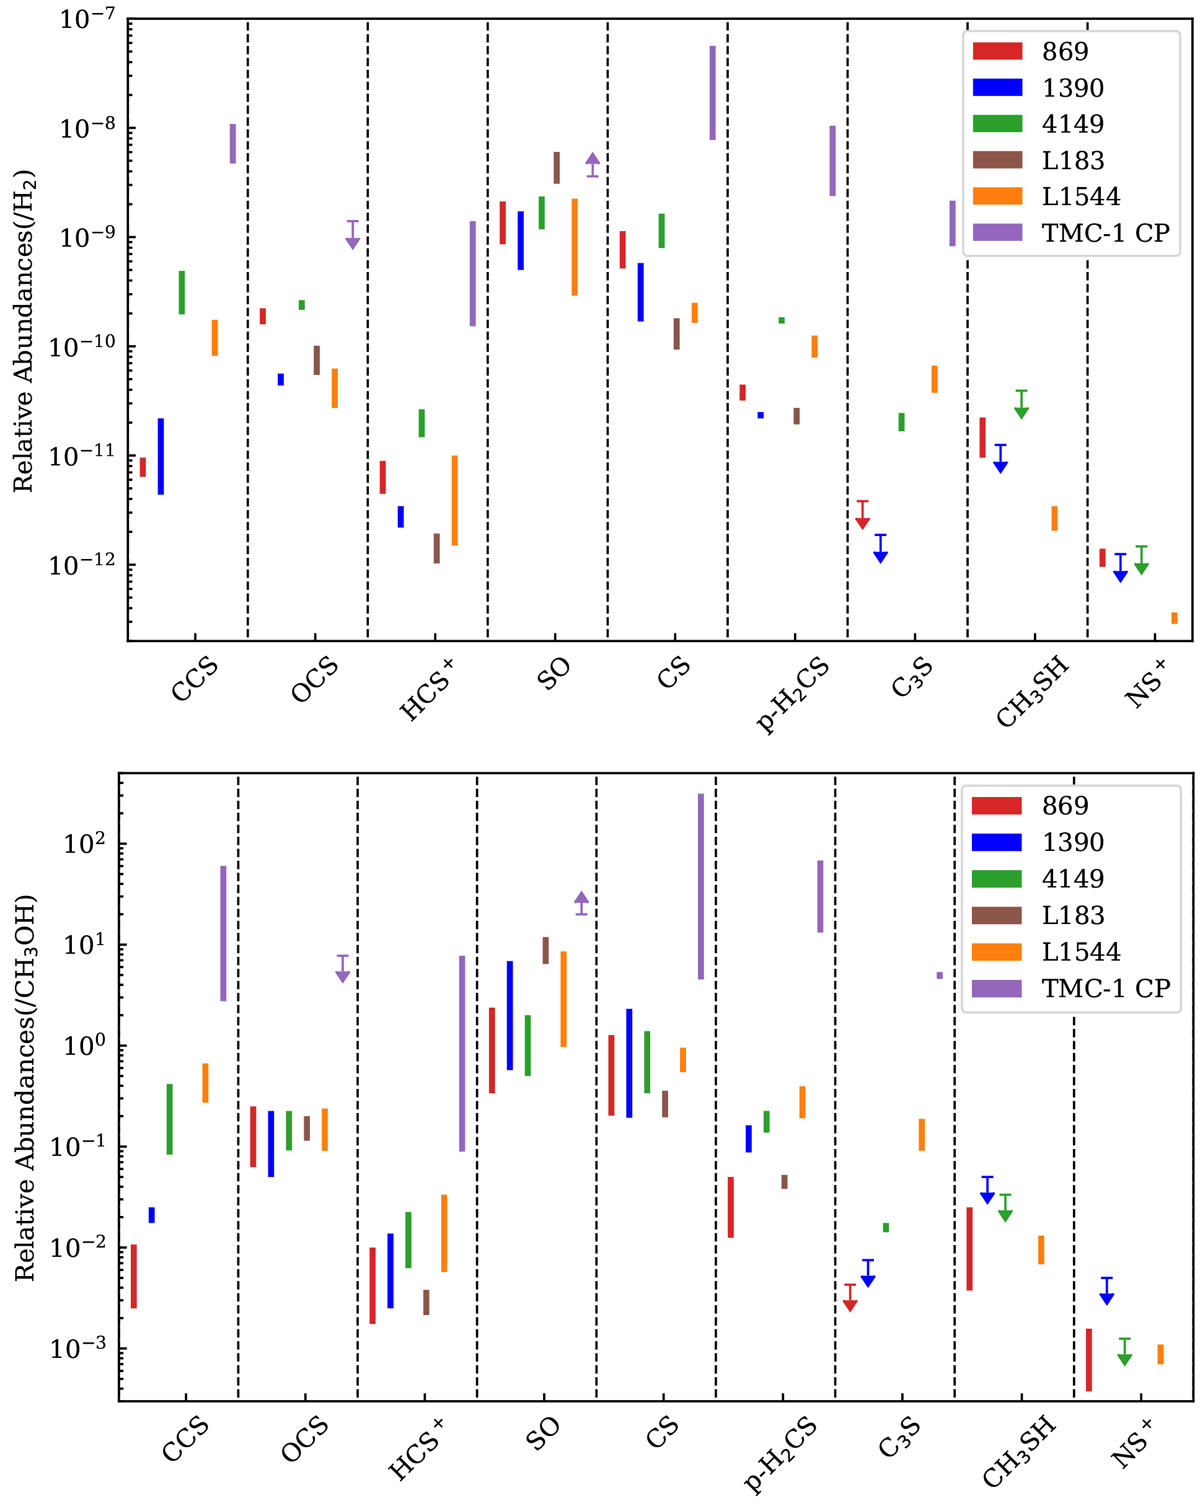
Relative abundances of sulphur-bearing species (main isotopologue) with H2 (top). The NCS and NSO are calculated from ![]() ,
,
![]() and 32S∕34S = (3.3 ± 0.5) (DGC/kpc) + 4.1 ± 3.1(~ 32 ± 5 for our cores), adopted from Chin et al. (1996). For the undetected species, we estimated the upper limit of their column densities based on the integrated area upper limit given in Table A.2. The sulphur-bearing species abundances are adopted from Lattanzi et al. (2020), Vastel et al. (2018b), and Gratier et al. (2016) for L183, L1544, and TMC-1 CP, respectively. The average N(H2) of L183 and L1544 are (10.0 ± 1.7) × 1022 cm−2 and (9.4 ± 1.6) × 1022 cm−2 (Crapsi et al. 2005), and the average N(H2) of TMC-1 CP is (1.4 ± 0.1) × 1022 cm−2 (Kauffmann et al. 2008). Relative abundances of sulphur-bearing molecules (main isotopologue) relative to CH3OH (bottom).
and 32S∕34S = (3.3 ± 0.5) (DGC/kpc) + 4.1 ± 3.1(~ 32 ± 5 for our cores), adopted from Chin et al. (1996). For the undetected species, we estimated the upper limit of their column densities based on the integrated area upper limit given in Table A.2. The sulphur-bearing species abundances are adopted from Lattanzi et al. (2020), Vastel et al. (2018b), and Gratier et al. (2016) for L183, L1544, and TMC-1 CP, respectively. The average N(H2) of L183 and L1544 are (10.0 ± 1.7) × 1022 cm−2 and (9.4 ± 1.6) × 1022 cm−2 (Crapsi et al. 2005), and the average N(H2) of TMC-1 CP is (1.4 ± 0.1) × 1022 cm−2 (Kauffmann et al. 2008). Relative abundances of sulphur-bearing molecules (main isotopologue) relative to CH3OH (bottom).
Current usage metrics show cumulative count of Article Views (full-text article views including HTML views, PDF and ePub downloads, according to the available data) and Abstracts Views on Vision4Press platform.
Data correspond to usage on the plateform after 2015. The current usage metrics is available 48-96 hours after online publication and is updated daily on week days.
Initial download of the metrics may take a while.