Open Access
Fig. 1
Download original image
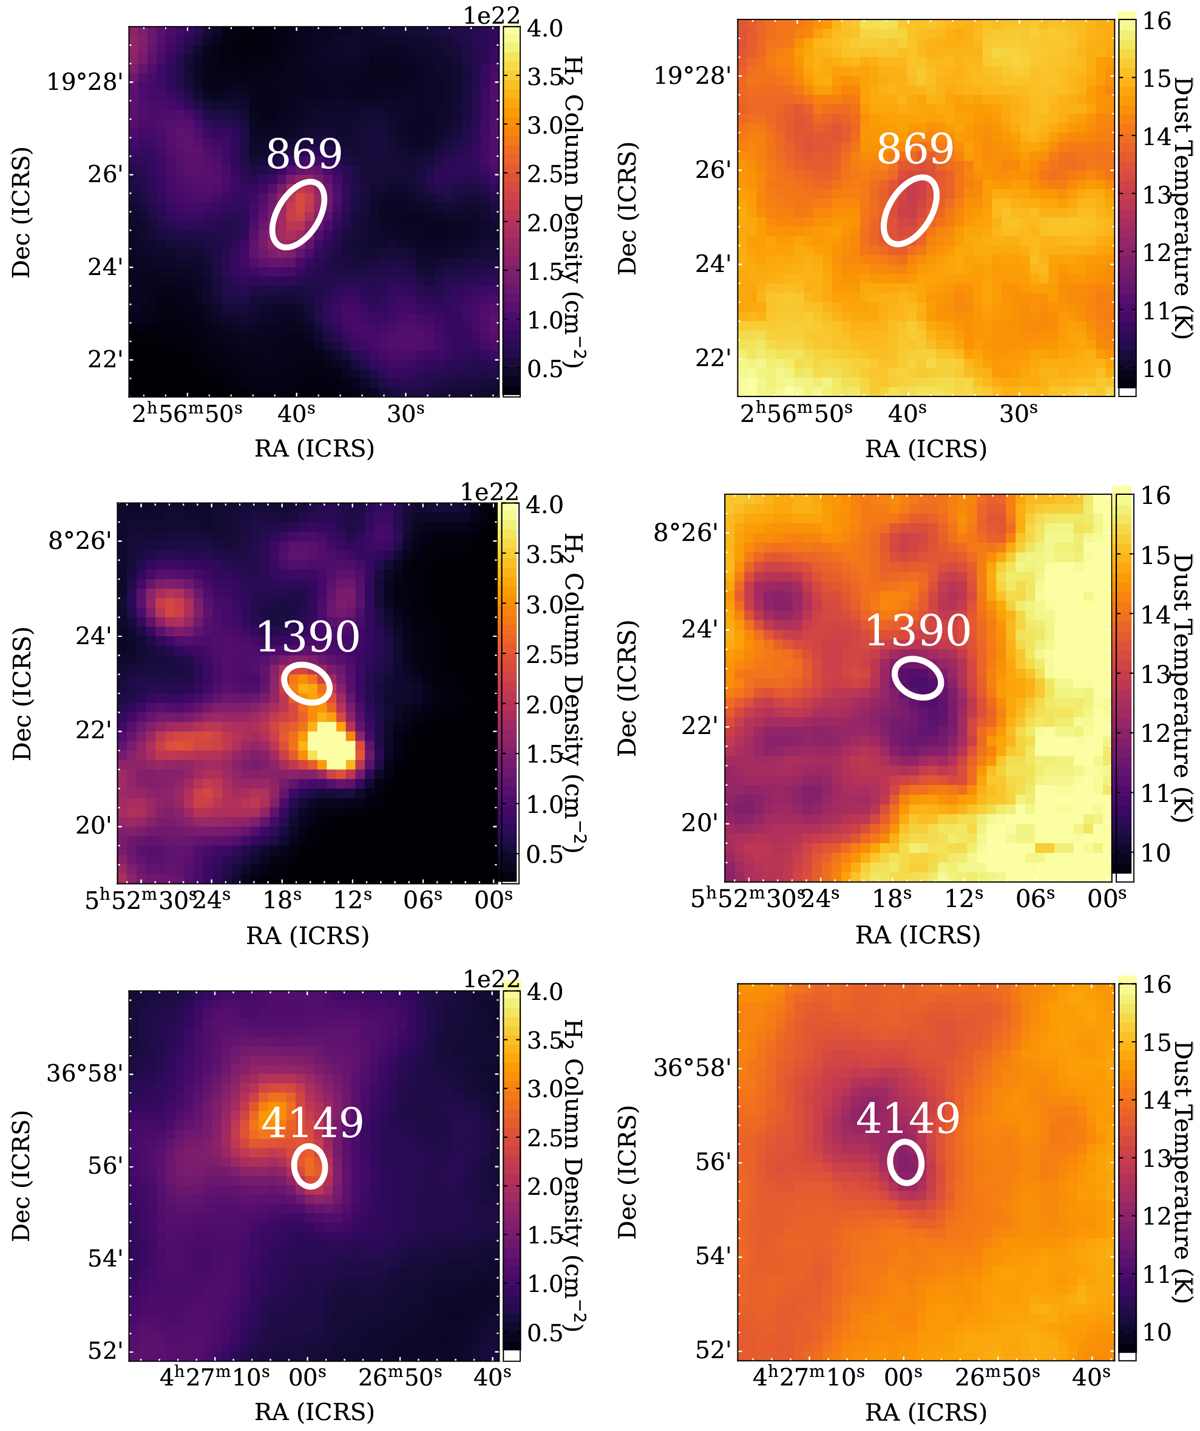
Herschel H2 column density (left) and dust temperature (right) maps of the three cores. The maps are generatedby SED fitting of Herschel data (Montillaud et al. 2015). The map sizes are 8′ × 8′. The white ellipses mark the size and the position of the cores extracted from the GCC catalogue, as described in Sect. 2.
Current usage metrics show cumulative count of Article Views (full-text article views including HTML views, PDF and ePub downloads, according to the available data) and Abstracts Views on Vision4Press platform.
Data correspond to usage on the plateform after 2015. The current usage metrics is available 48-96 hours after online publication and is updated daily on week days.
Initial download of the metrics may take a while.