Fig. 3
Download original image
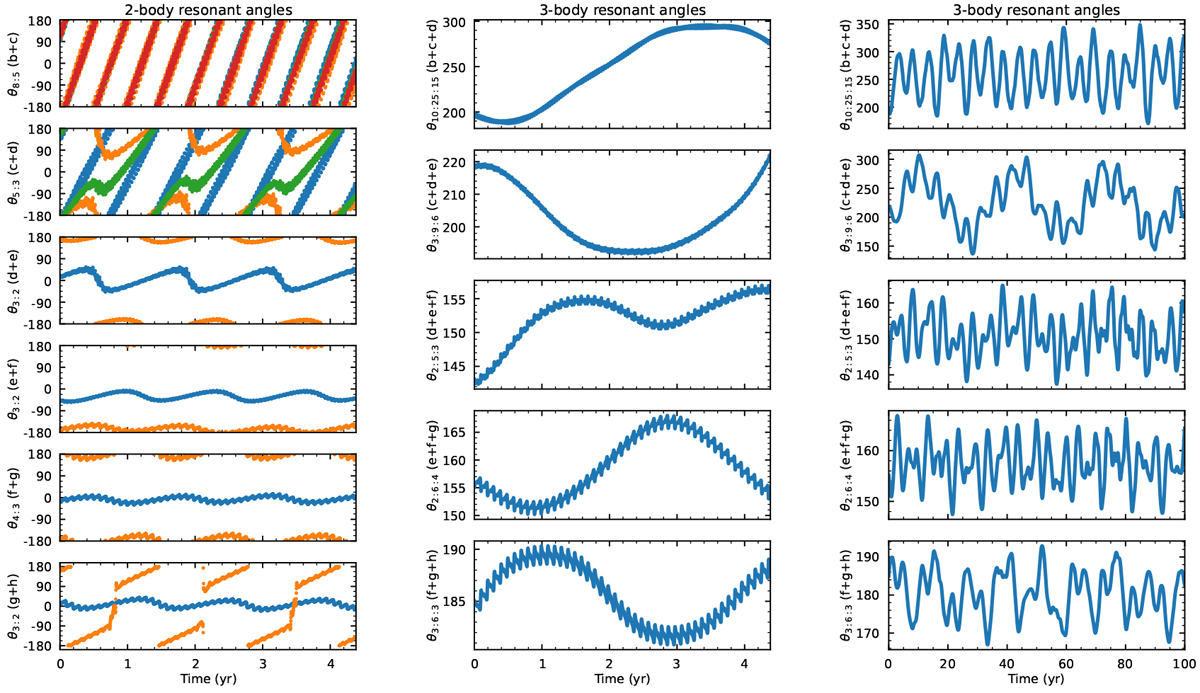
Time evolution of the resonant angles of the Agol et al. (2021) best fit. The left column shows the two-body resonant angles from Eqs. (2) to (12). The color scheme is as follows: blue is first angle θ(1), orange θ(2), and if present, green and red θ(3) and θ(4), respectively. The middle and right columns show the three-body resonant angles from Eqs. (13) to (17). In the middle column they are plotted over the same 1600 days timescale as the two-body angles. On the right column they are plotted on a longer timeframe of 100 yr.
Current usage metrics show cumulative count of Article Views (full-text article views including HTML views, PDF and ePub downloads, according to the available data) and Abstracts Views on Vision4Press platform.
Data correspond to usage on the plateform after 2015. The current usage metrics is available 48-96 hours after online publication and is updated daily on week days.
Initial download of the metrics may take a while.