Fig. 14
Download original image
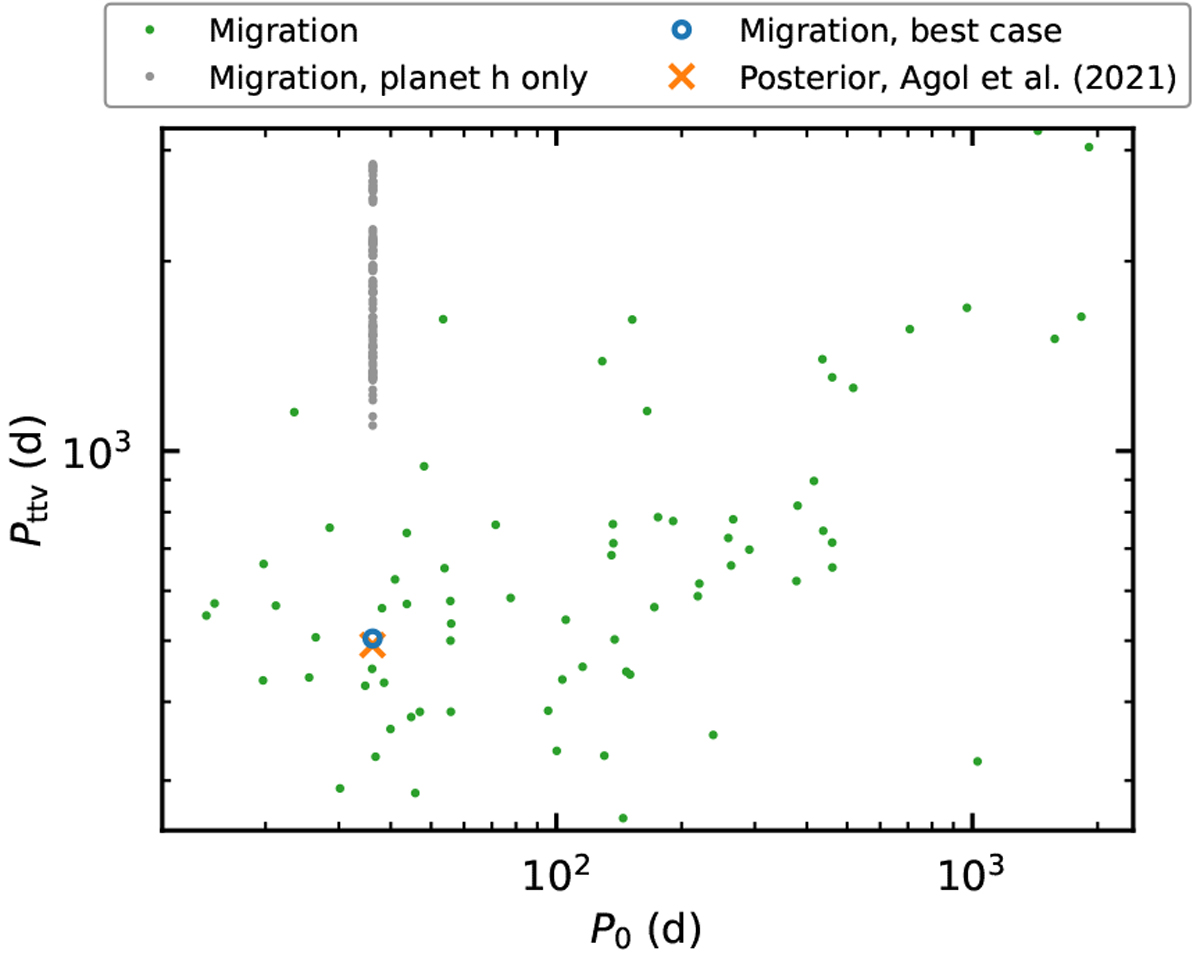
Relevant periods of simulated systems: P0 and PTTV (see Sect. 4). Green points are for the simulations presented in Sect. 3.4 and grey points for the simulations presented in Sect. 4. The blue circle represents our best-case disc migration simulation (Sect. 3.5), and the orange cross represents the best-fit solution of Agol et al. (2021).
Current usage metrics show cumulative count of Article Views (full-text article views including HTML views, PDF and ePub downloads, according to the available data) and Abstracts Views on Vision4Press platform.
Data correspond to usage on the plateform after 2015. The current usage metrics is available 48-96 hours after online publication and is updated daily on week days.
Initial download of the metrics may take a while.