Fig. 12
Download original image
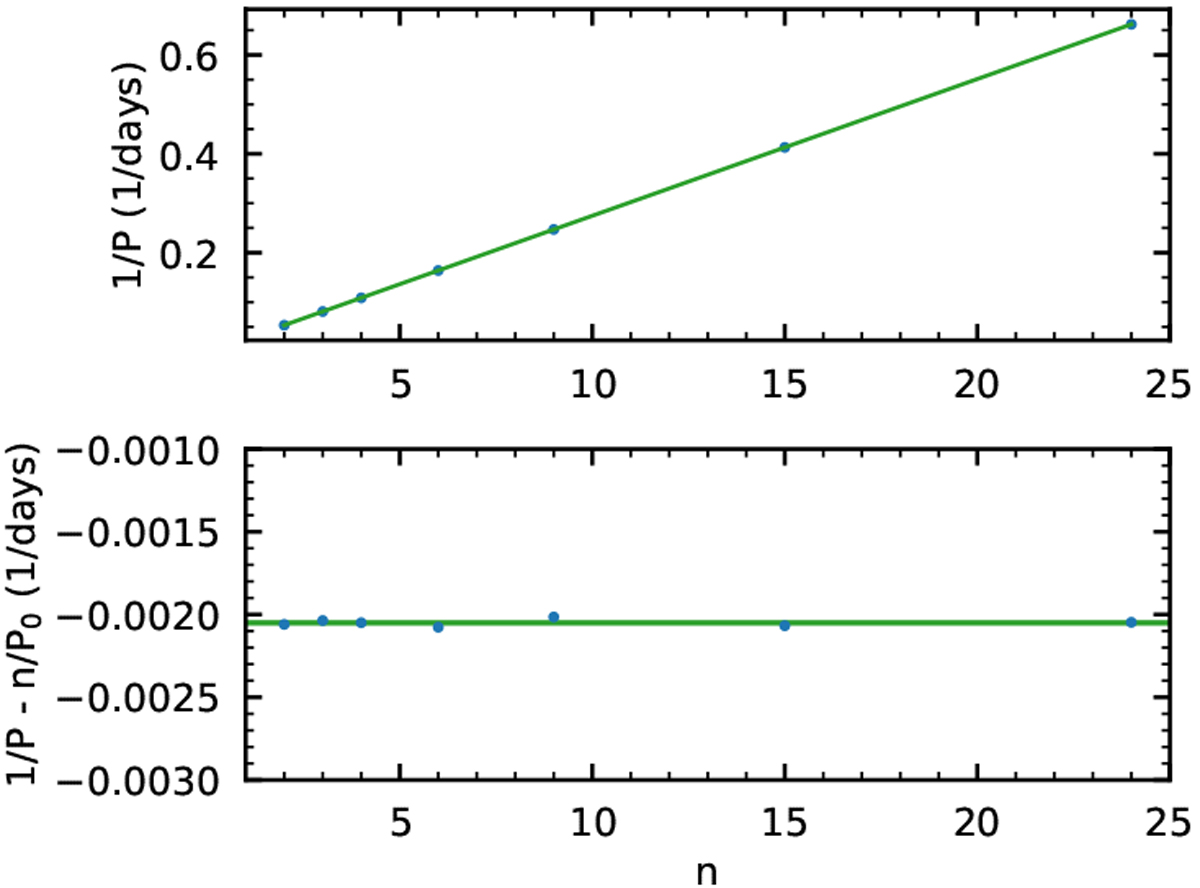
Top panel: The blue points (planets h to b, left to right) are the observed orbital frequencies P−1 (where the P’s are the planets’ orbital periods, see Table 1) as a function of the series of integers n = [2, 3, 4, 6, 9, 15, 24]. When applying a linear fit (green line), the slope corresponds to a period P0 = 0.09 yr. Bottom panel: plot of ![]() as a functionof n, showing a residual frequency corresponding to a period of ~1.3 yr.
as a functionof n, showing a residual frequency corresponding to a period of ~1.3 yr.
Current usage metrics show cumulative count of Article Views (full-text article views including HTML views, PDF and ePub downloads, according to the available data) and Abstracts Views on Vision4Press platform.
Data correspond to usage on the plateform after 2015. The current usage metrics is available 48-96 hours after online publication and is updated daily on week days.
Initial download of the metrics may take a while.