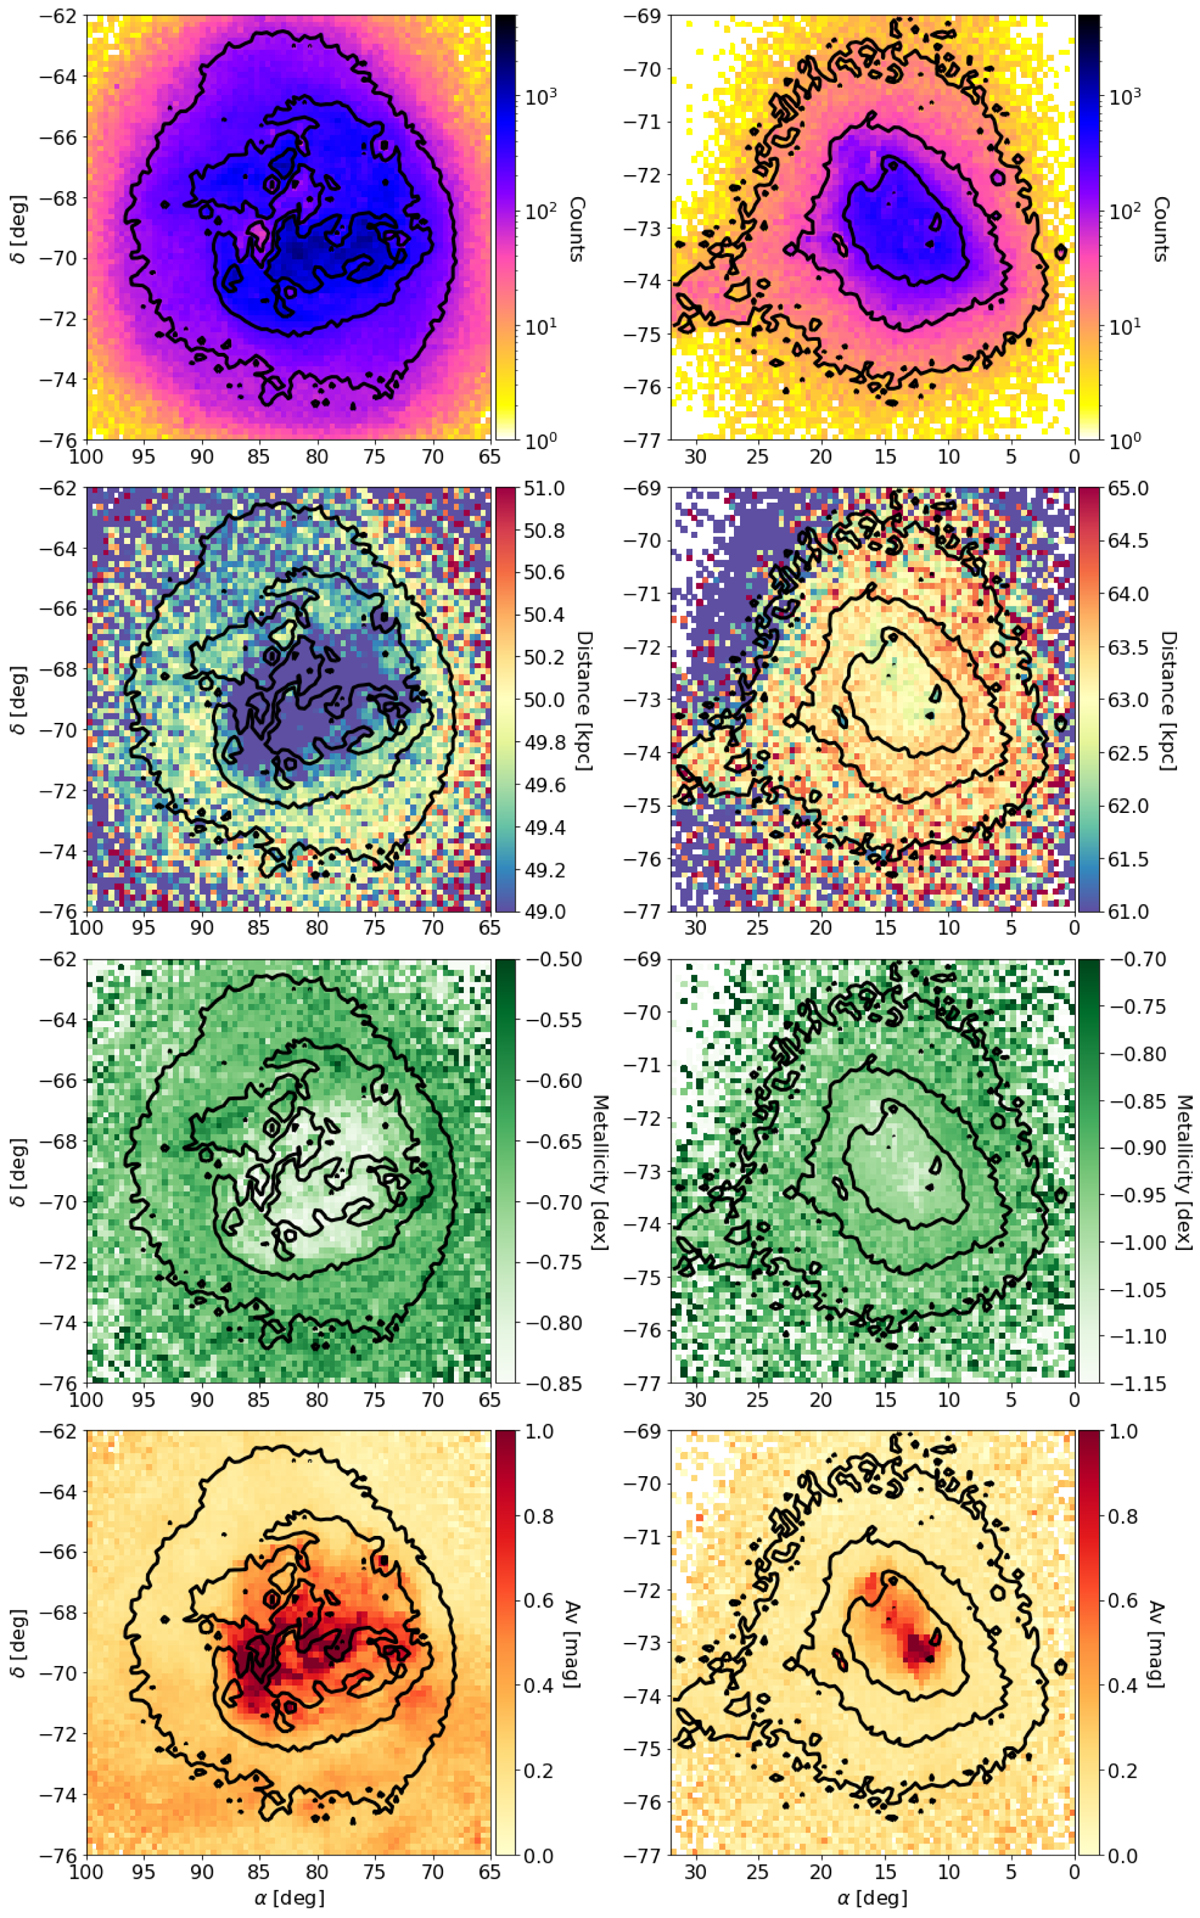
Fig. 9.
Download original image
Median sky density, distance, metallicity, and extinction maps (from top to bottom) of the Magellanic Clouds as seen by StarHorse (in equatorial coordinates and only including objects with dist50 > 25 kpc). Left panels: centred on the LMC, right panels: on the SMC. The contour lines in each of the panels are derived from the sky density plots in the top panels. For the LMC, the contours are drawn at stellar densities of [100, 300, 700] per pixel (from outside inwards), with 905 205 sources within the outermost contour. For the SMC, the contour lines correspond to levels [10, 50, 200], with 195 634 sources contained inside the outermost contour.
Current usage metrics show cumulative count of Article Views (full-text article views including HTML views, PDF and ePub downloads, according to the available data) and Abstracts Views on Vision4Press platform.
Data correspond to usage on the plateform after 2015. The current usage metrics is available 48-96 hours after online publication and is updated daily on week days.
Initial download of the metrics may take a while.