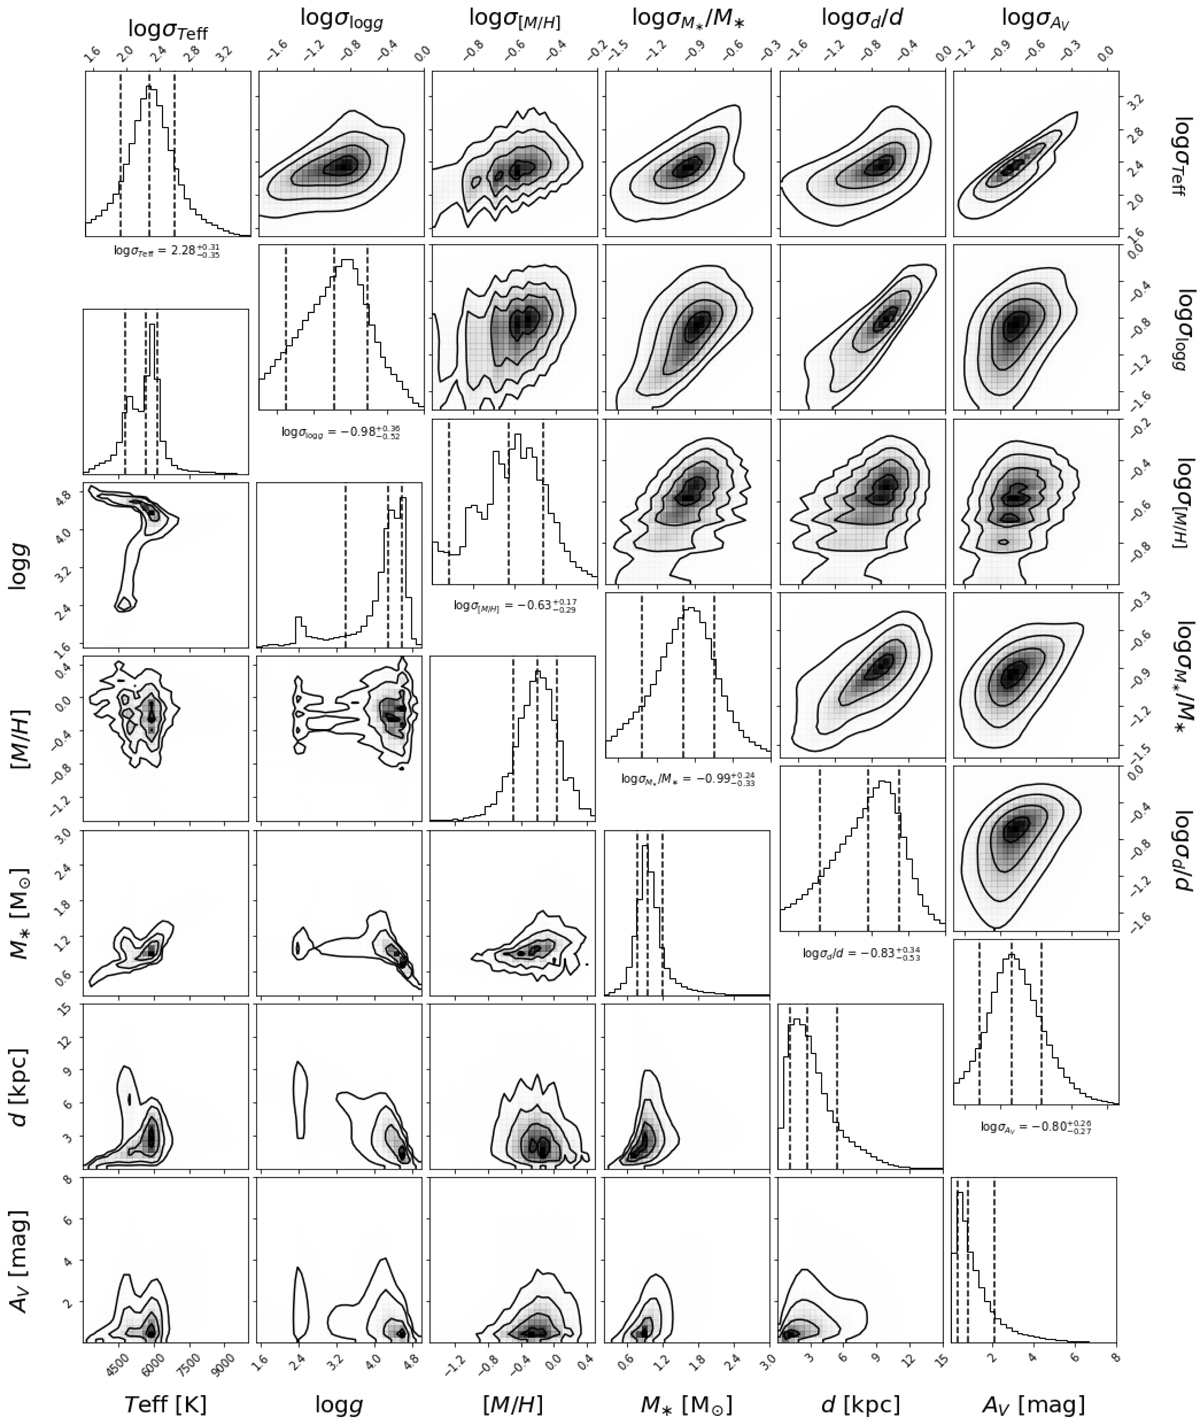
Fig. 3.
Download original image
corner plots showing the correlations and distributions of StarHorse median posterior output values Teff, log g, [M/H], M*, d, and AV (lower-left panels), and their corresponding uncertainties (in logarithmic scale; top-right panels) for all stars in our catalogue. The dashed vertical lines in the diagonal panels show the 16th, 50th, and 84th percentiles of each parameter.
Current usage metrics show cumulative count of Article Views (full-text article views including HTML views, PDF and ePub downloads, according to the available data) and Abstracts Views on Vision4Press platform.
Data correspond to usage on the plateform after 2015. The current usage metrics is available 48-96 hours after online publication and is updated daily on week days.
Initial download of the metrics may take a while.