Fig. D.1.
Download original image
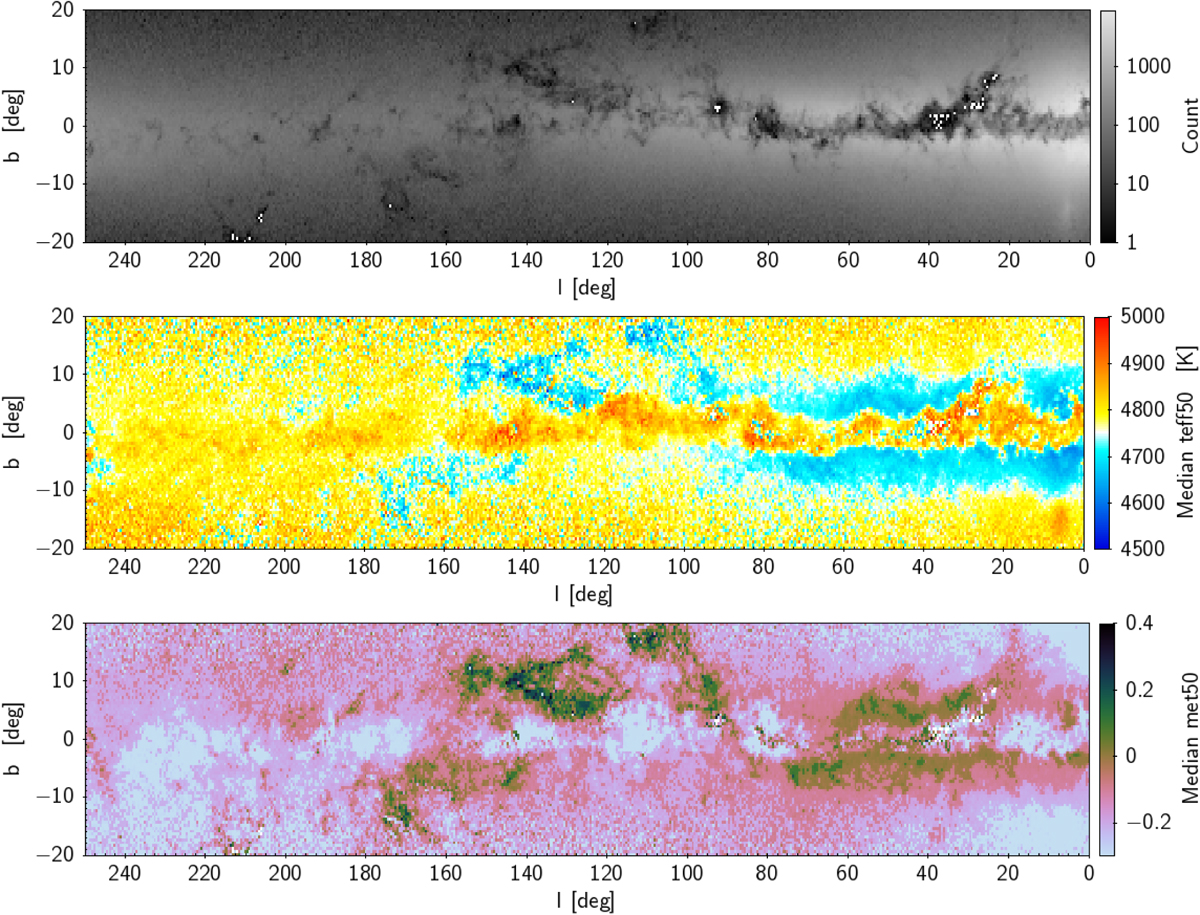
Sky map of the red-clump star sample for a region close to the Galactic plane (0 < l < 250, −20 < b < 20), revealing systematics possibly related to variations in the Galactic extinction law (compare with Fig. 1 of Schlafly et al. 2017). The top panel is colour-coded by number density, the second panel by median effective temperature, and the bottom panel by median metallicity.
Current usage metrics show cumulative count of Article Views (full-text article views including HTML views, PDF and ePub downloads, according to the available data) and Abstracts Views on Vision4Press platform.
Data correspond to usage on the plateform after 2015. The current usage metrics is available 48-96 hours after online publication and is updated daily on week days.
Initial download of the metrics may take a while.