Fig. 1
Download original image
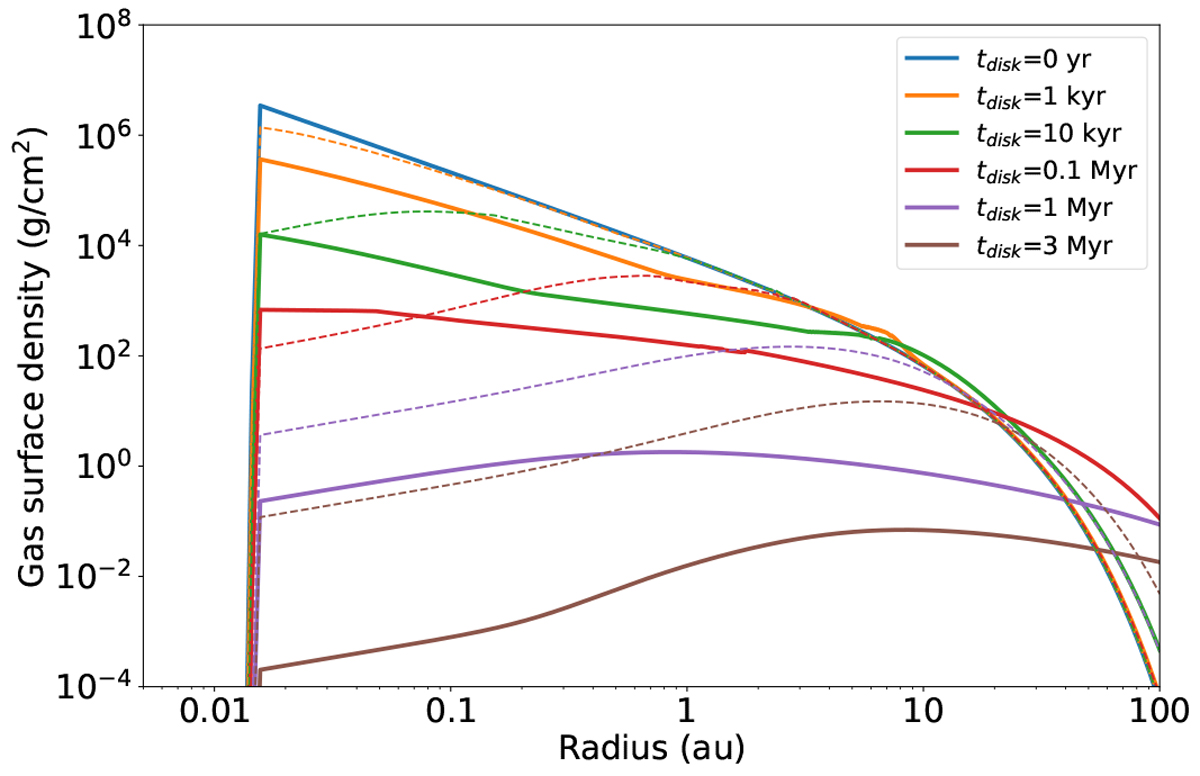
Temporal evolution of the gas surface density for our main simulation (solid curves). The dashed curves are for our additional simulation with lower turbulent viscosity. Initially, the distribution has a power-law index of −3/2, but the index changes with time in the inner region due to the influence of disk winds. As in previous studies, the inner disk edge is placed at r = 0.015 au. The start time of N-body simulations is delayed by t0 from tdisk.
Current usage metrics show cumulative count of Article Views (full-text article views including HTML views, PDF and ePub downloads, according to the available data) and Abstracts Views on Vision4Press platform.
Data correspond to usage on the plateform after 2015. The current usage metrics is available 48-96 hours after online publication and is updated daily on week days.
Initial download of the metrics may take a while.