Fig. 7
Download original image
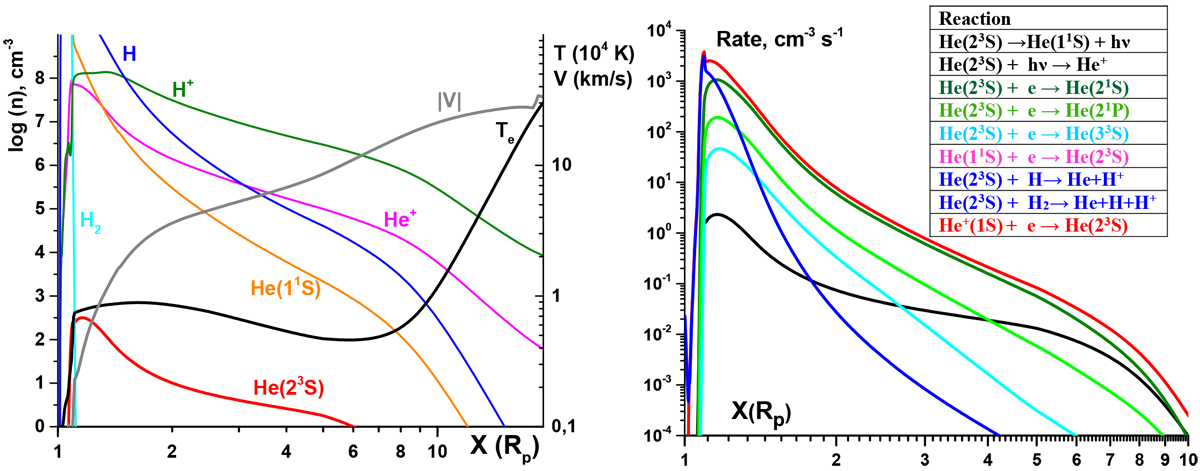
Profiles along the planet-to-star direction. Left: temperature (black line) and velocity (grey line) of protons (in 104 K and km s−1, respectively; the scale for both is on the right axis) and density of major species labelled in the plot (left axis). Right: rates of the reactions responsible for the processes of population and depopulation of metastable He I listed in the legend. The black line shows the sum of reactions 1 and 2, while the blue line is the sum of reactions 7 and 8 (see legend). The x axes are in units of planetary radii.
Current usage metrics show cumulative count of Article Views (full-text article views including HTML views, PDF and ePub downloads, according to the available data) and Abstracts Views on Vision4Press platform.
Data correspond to usage on the plateform after 2015. The current usage metrics is available 48-96 hours after online publication and is updated daily on week days.
Initial download of the metrics may take a while.