Fig. 6
Download original image
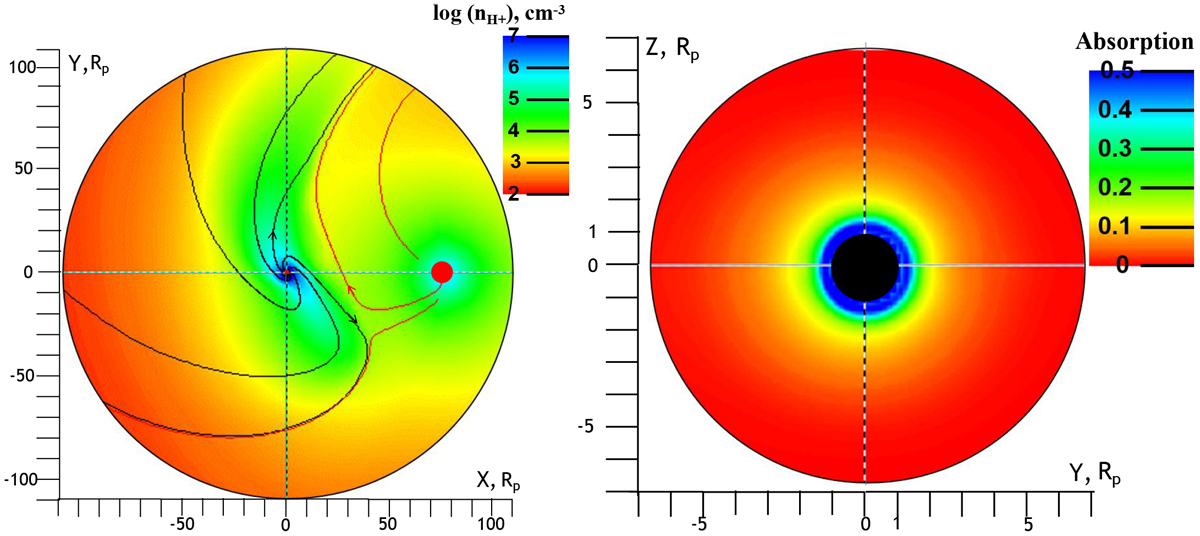
Simulation results. Left: proton density distribution in the orbital plane of the whole simulated space comprising the WASP-80 system. The planet is at the centre of the coordinate system (0,0) and moves anti-clockwise relative to the starthat is located at (76,0). The red dots indicate the position and size of the star (right) and planet (centre). The black and red lines correspond to the proton fluid streamlines originated from the planet and the star, respectively. The axes are in units of planetary radii. Right: distribution of metastable He I local absorption (from 0, which is no absorption, to 1, which is full absorption) along the line of sight at mid-transit integrated over ±10 km s−1. The whole plotted circle corresponds to the stellar disk, while the lower boundary of the simulated planetary atmosphere is shown by the black circle.
Current usage metrics show cumulative count of Article Views (full-text article views including HTML views, PDF and ePub downloads, according to the available data) and Abstracts Views on Vision4Press platform.
Data correspond to usage on the plateform after 2015. The current usage metrics is available 48-96 hours after online publication and is updated daily on week days.
Initial download of the metrics may take a while.