Fig. 3
Download original image
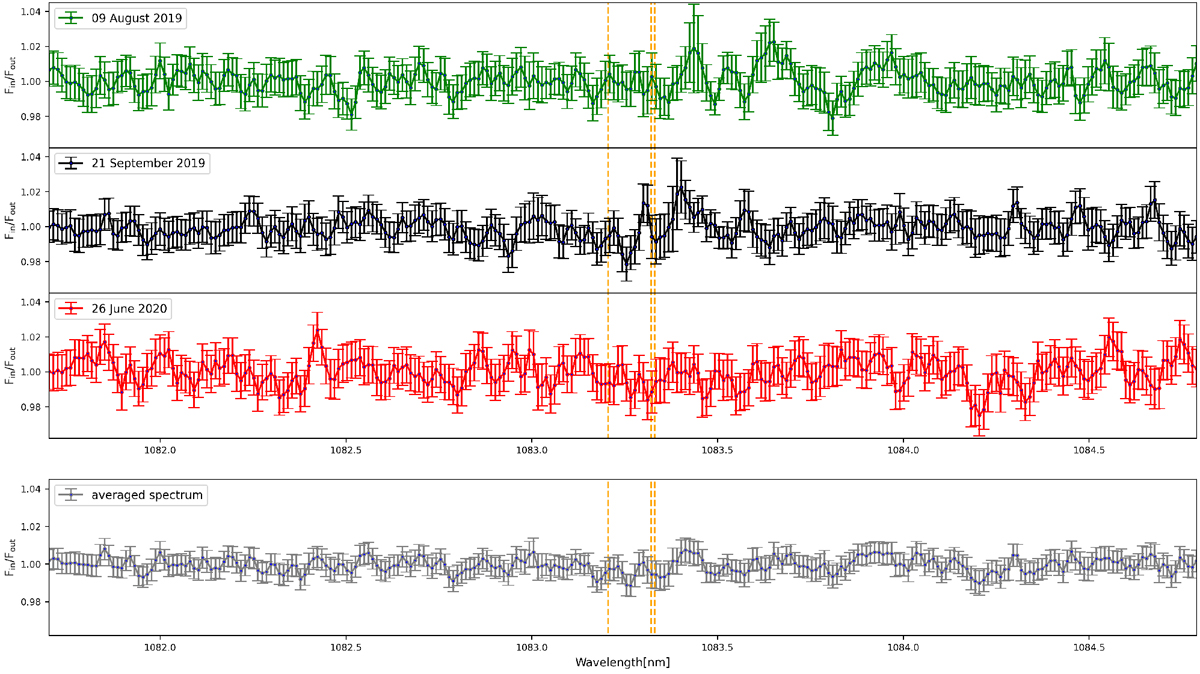
Transmission spectra in the region of the metastable He I triplet. Top: weighted-mean-averaged transmission spectrum for each observed transit. Bottom: weighted mean of the three observed transits. Vertical orange lines mark the position of the three components of the metastable He I triplet. Since the final error bars are calculated following error propagationby taking the square roots of the extracted spectra aligned in the telluric rest frame as initial errors, the final error bars correspond to one standard deviation.
Current usage metrics show cumulative count of Article Views (full-text article views including HTML views, PDF and ePub downloads, according to the available data) and Abstracts Views on Vision4Press platform.
Data correspond to usage on the plateform after 2015. The current usage metrics is available 48-96 hours after online publication and is updated daily on week days.
Initial download of the metrics may take a while.