Free Access
Fig. 2
Download original image
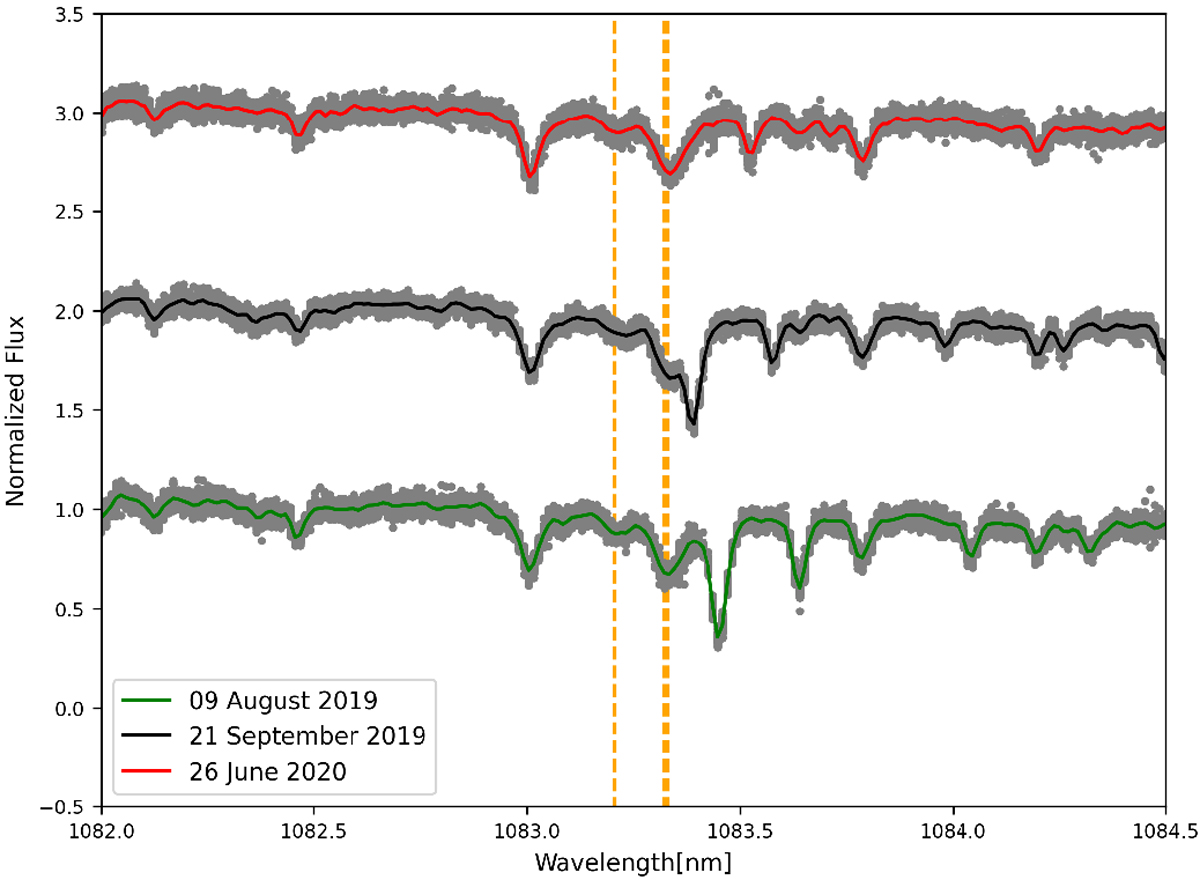
Normalised spectra in the stellar rest frame of the three considered transits (grey dots), with the correspondent time-averaged spectrum overlaid. The spectra are plotted with vertical offsets for clarity. Vertical orange lines mark the position of the three components of the metastable He I triplet.
Current usage metrics show cumulative count of Article Views (full-text article views including HTML views, PDF and ePub downloads, according to the available data) and Abstracts Views on Vision4Press platform.
Data correspond to usage on the plateform after 2015. The current usage metrics is available 48-96 hours after online publication and is updated daily on week days.
Initial download of the metrics may take a while.